What Flint abstracts
Interactive charts are harder to generate than static ones. An agent may need several rounds of reasoning, coding and debugging, increasing both time and token use. Complex interactions can also break a layout or leave features unusable; attempts to fix one problem may introduce another.
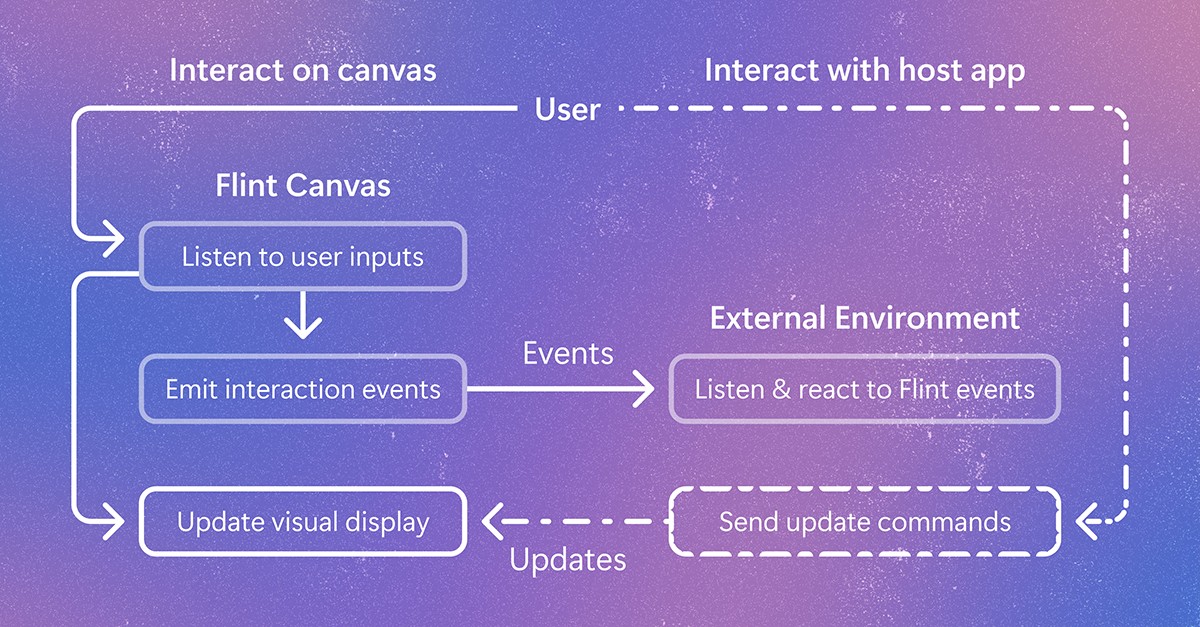
Flint-interactive is designed to move that complexity into the compiler. Simple actions such as clicks, drags and key presses become semantic events that identify the selected chart elements and data. Developers then connect those events to higher-level update operators.
Source: microsoft.com
That separation lets an interaction affect more than the chart itself. A selection can filter a table, update another chart or change application state. Chart updates can also apply styles, add annotations or change the viewport for panning and zooming.
From chat to application
Flint Interactive can connect to a chat or canvas environment through Flint-MCP and MCP Apps. A user can ask an agent for a chart and specify the desired interactions; the agent produces both a Flint chart specification and an interaction specification, then displays the chart in the conversation.
For dashboards and data stories, developers can use Flint Interactive Canvas. They can also define a custom trigger and handler through the API when the built-in interactions do not fit. One example is highlighting a selected country and labeling it, using style and annotation operators rather than directly controlling the underlying rendering system.
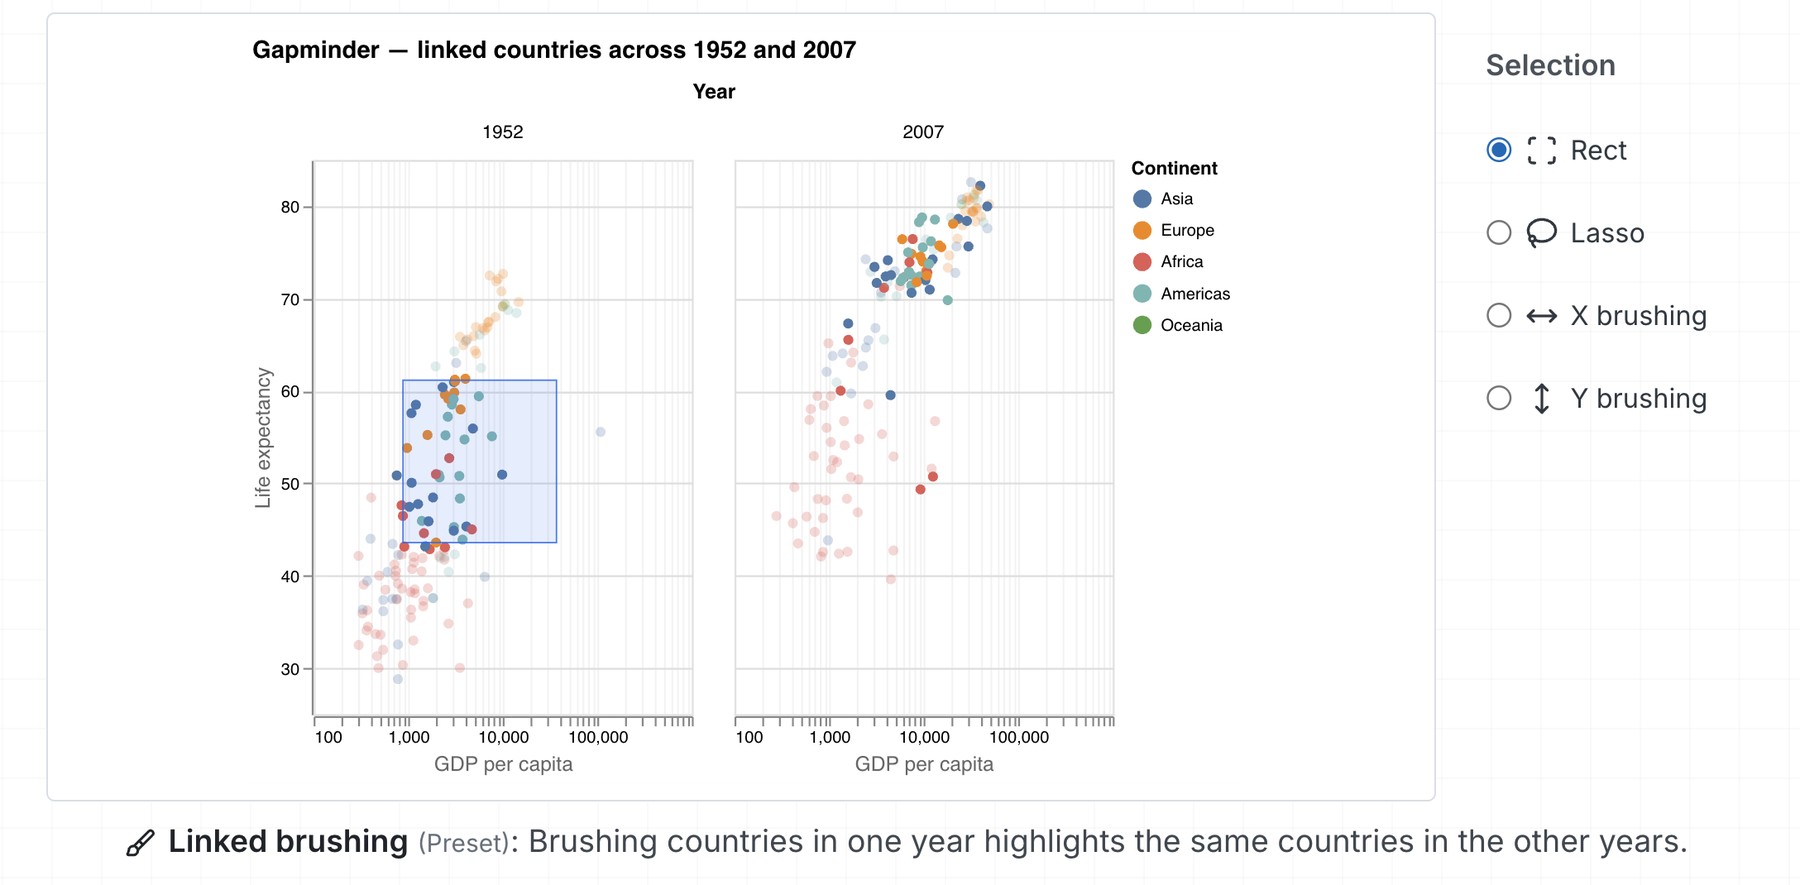
Example 1: We can enable the user to brush one visual view, and the chart highlights all groups of country selected by the user with a simple preset interaction linked-brush.
Source: microsoft.com
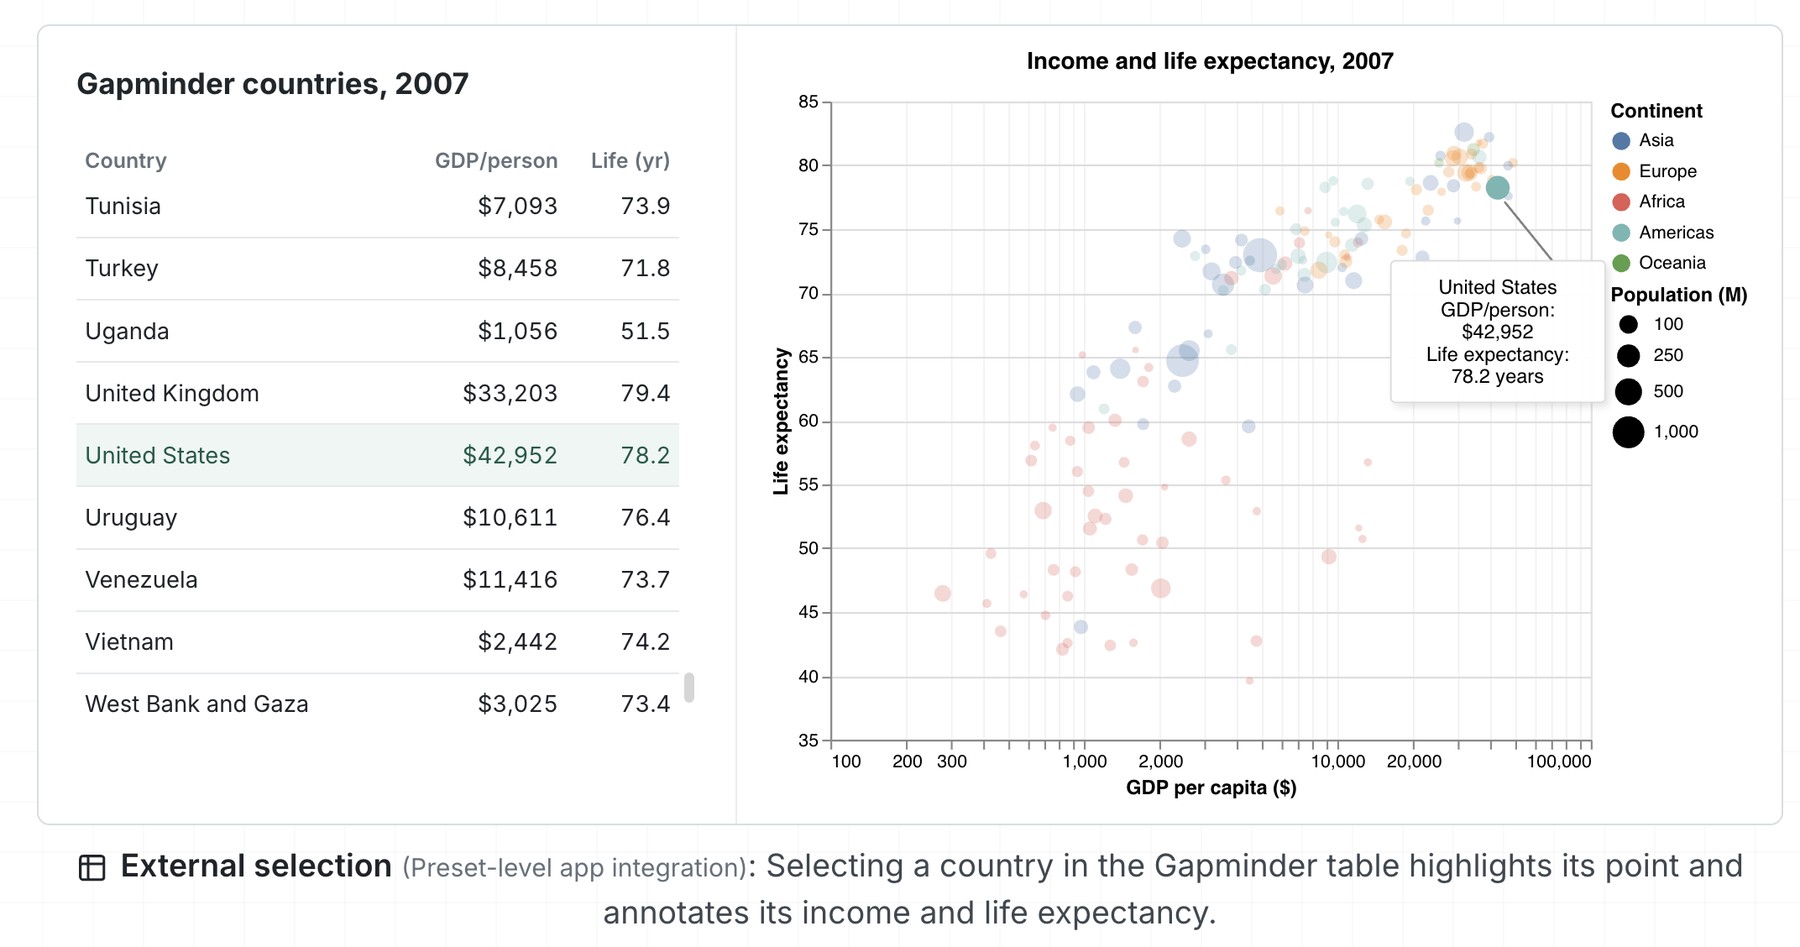
Example 2: Flint-interactive allows developers to define interactions between charts and external elements (e.g., table, paragraph). Here, the user can click the table to highlight points in the chart and verse versa.
Source: microsoft.com
The question is whether abstraction is enough
Flint’s central bet is that agents will produce better interactive visualizations if they can describe behavior semantically instead of generating low-level display code. I think that is a sensible place to focus: the announcement identifies repeated coding and debugging as both a cost problem and a reliability problem, and its answer is to give the compiler more responsibility.
But the description leaves out the evidence that would make the case convincing. It gives no measures of generation cost, reliability or how often agents succeed on complex interactions. The language may make interactions easier to express; that alone does not show that agents will choose the right ones or produce charts that help people understand the data.
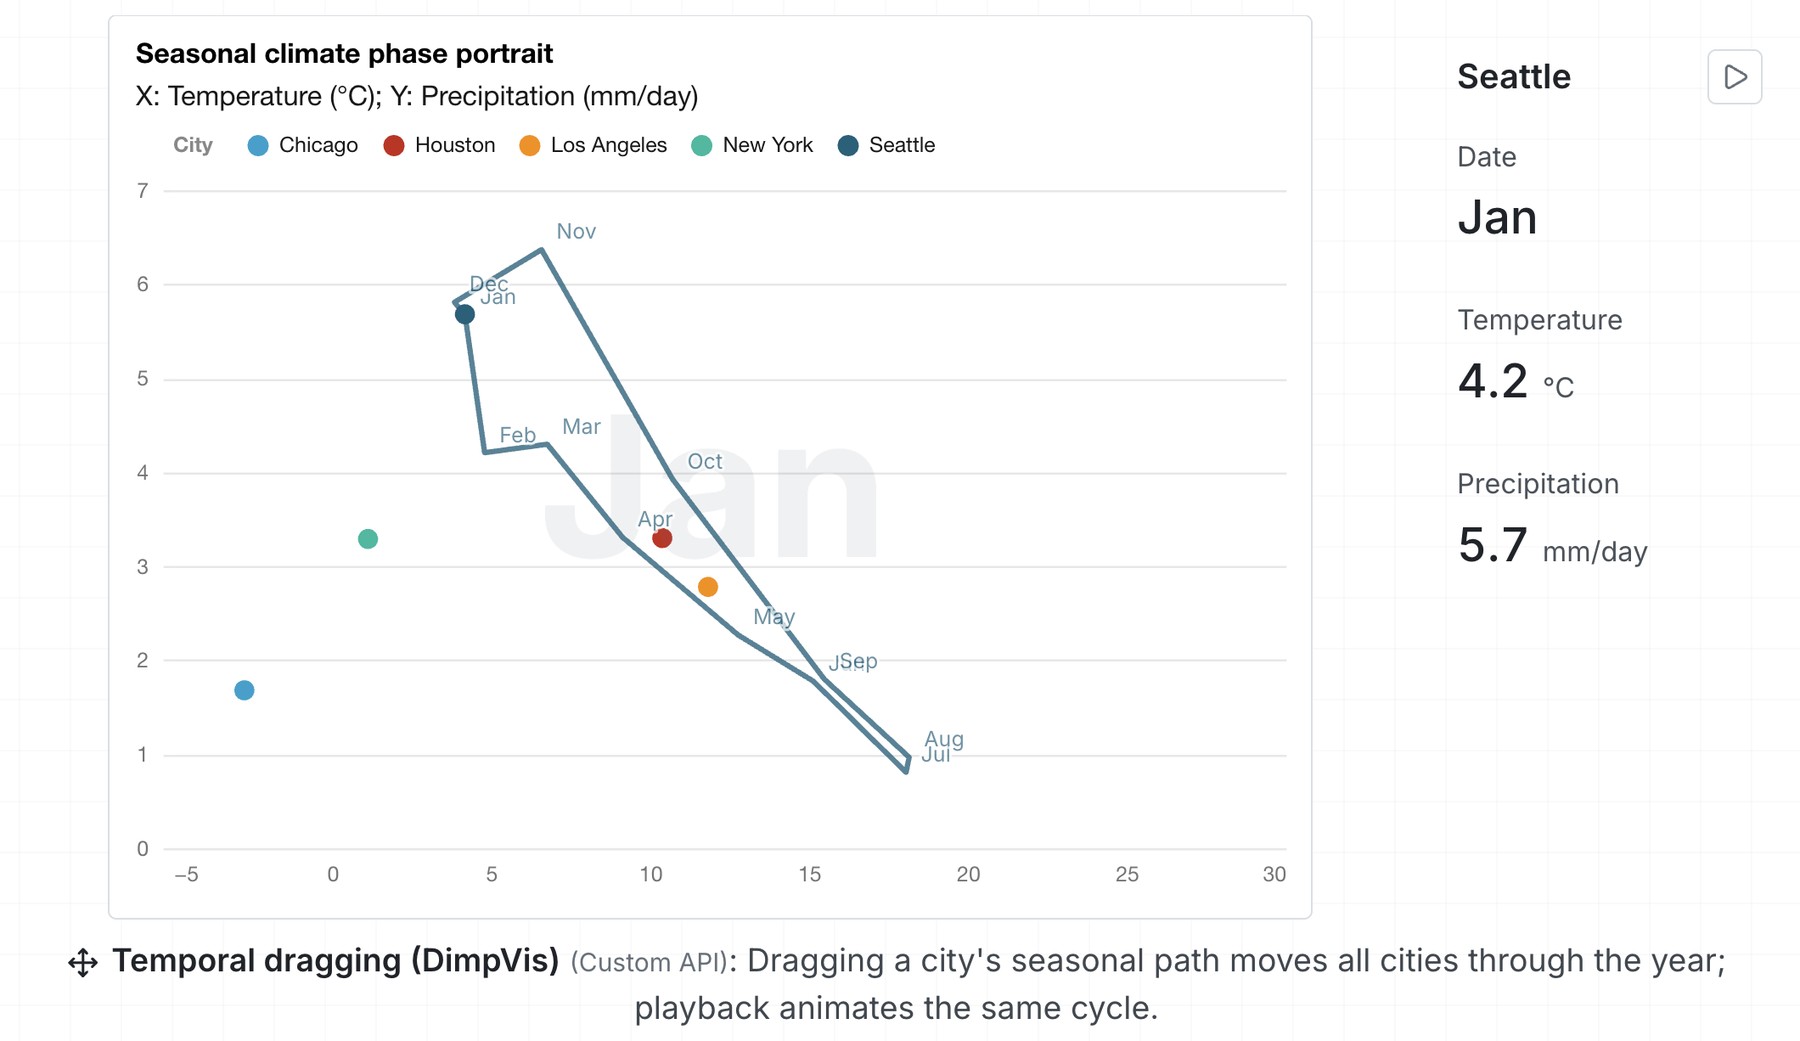
Example 4: The agent can create bespoke interactive visualizations with Flint’s programming API. In this DimpVis example, the user can drag the point along the time path to visualize how all cities’ temperature and precipitation changes.
Source: microsoft.com
For application developers, the promise is reusable interactions that can connect charts, tables, text and widgets. Designers can also develop custom patterns and share them as reusable templates.
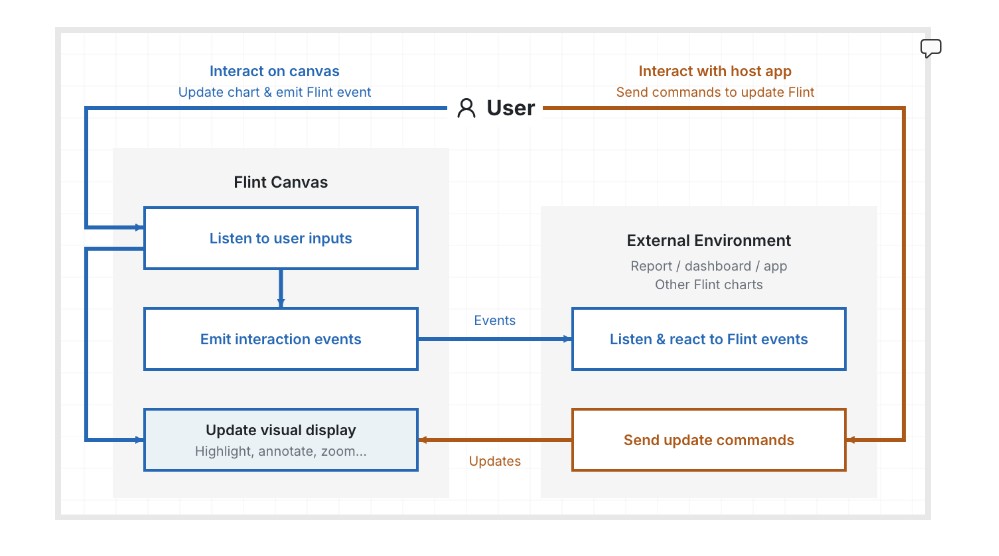
Figure 1: Flint interactive allows the agent to describe interaction logic by mapping “what semantic event is the user interacting with” to “what updates they want for the canvas surface”. The compiler takes the heavy lifting of resolving visual updates and manages the runtime, which makes interaction authoring more reliable c and cost effective.
Source: microsoft.com
Flint makes the compiler the bridge between an agent’s description and a working visualization. The test is whether that bridge reduces the failures that make interactive charts costly in the first place.
Source: microsoft.com
Daily AI news
Every day we pick what actually matters in AI and explain it plainly — no hype, no filler. Subscribe if you want to follow where the industry is going.
Only what matters — every day
Follow on X