
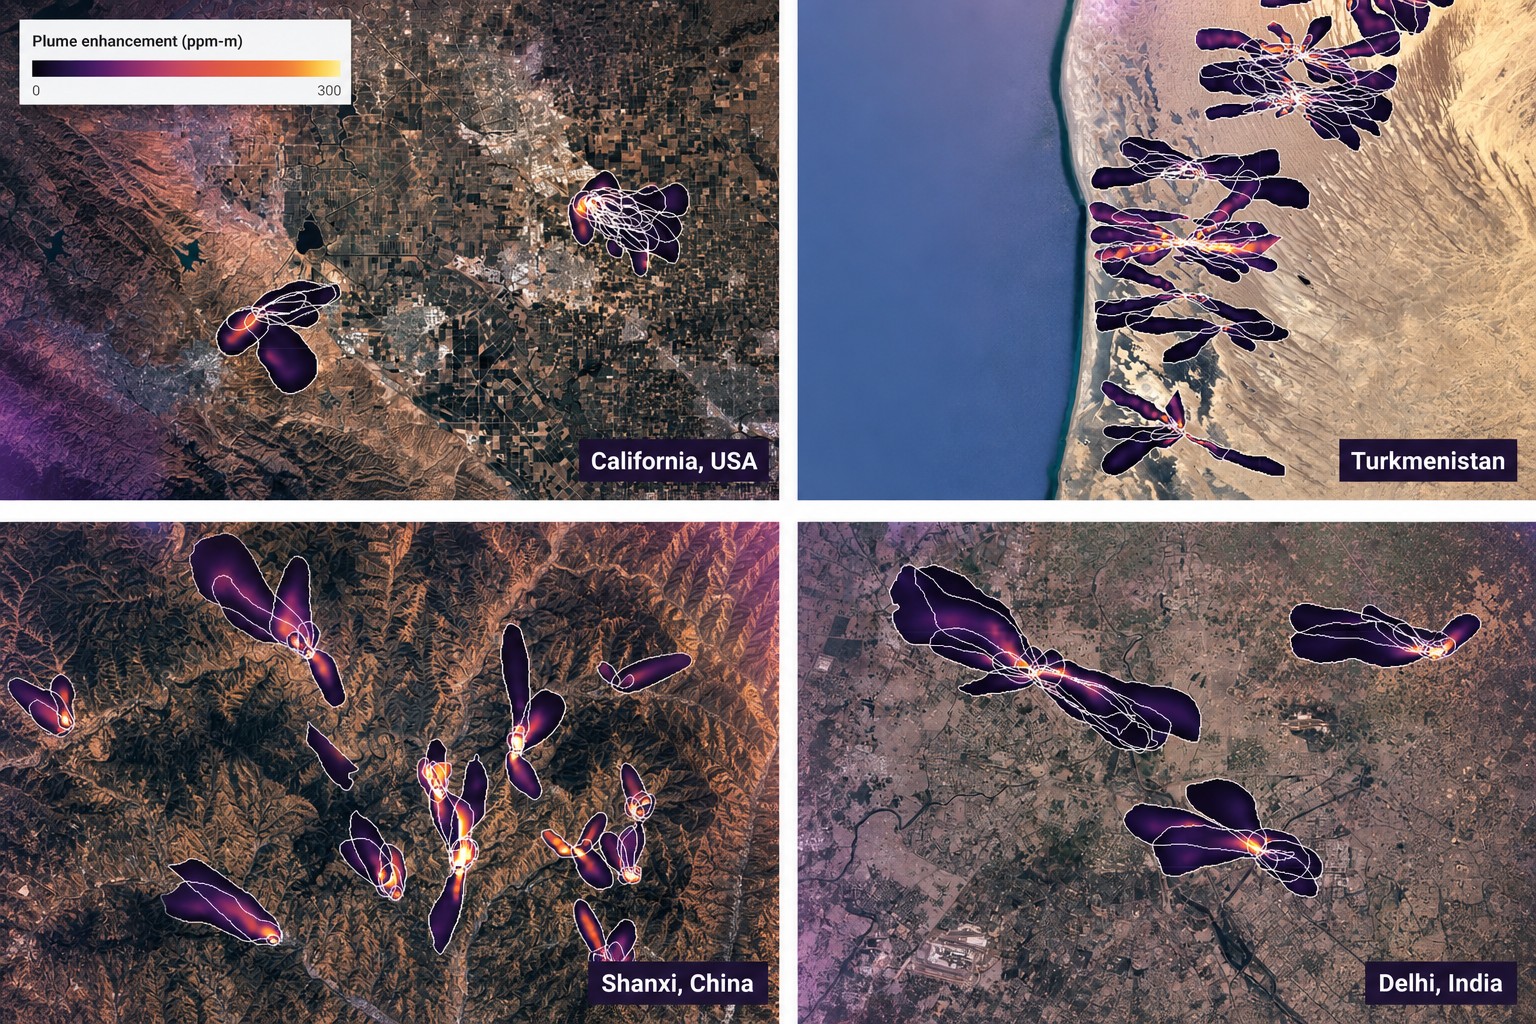
Google Research and NASA's Jet Propulsion Laboratory have published MAPL-EMIT in the Proceedings of the National Academy of Sciences: a deep learning system that detects methane plumes worldwide, estimates their signal enhancement, and locates their sources. It reads hyperspectral imagery from EMIT, an instrument on the International Space Station that was built to map the mineral composition of arid regions. Against expert-labeled plumes the model reaches 84% recall with a better signal-to-noise ratio than existing matched-filter enhancement methods. The trained model, the synthetic training data, a global plume database and an inference library have all been released.
The case for chasing methane is a timing argument. Over 100 years its global warming potential runs about 30 times that of carbon dioxide, and it accounts for roughly 25% of human-caused warming since the start of the industrial era. Because it persists in the atmosphere for a comparatively short time, cutting emissions now slows the temperature curve sooner than almost anything else available. That logic is what more than 125 countries signed up to in the Global Methane Pledge, which targets a 30% cut by 2030. Hitting it requires finding local point sources, single sites tens of meters across, in energy, agriculture and waste; the cheapest reductions sit at oil and gas facilities, farms and landfills.
Satellite methane monitoring is a three-way trade between field of view, spatial resolution and spectral resolution, and the two instruments involved sit at opposite corners of it. Global mappers such as TROPOMI are built to catch small shifts in background concentration: a swath around 2,600 km wide, coarse spatial resolution of about 5.5 by 3.5 km, and fine 0.1 nm spectral sampling. EMIT is built for facility-level emissions: an 80 km field of view, 60 m spatial resolution, and moderate 7.4 nm spectral sampling, which is enough to register methane's chemical signature at a high signal-to-noise ratio. EMIT records hundreds of separate bands of light for every pixel, which is how an invisible gas leaves a fingerprint.
Ordinary visible imagery shows nothing. NASA's L2B matched-filter method returns a noisy signal. MAPL-EMIT separates the plume from the landscape around it.
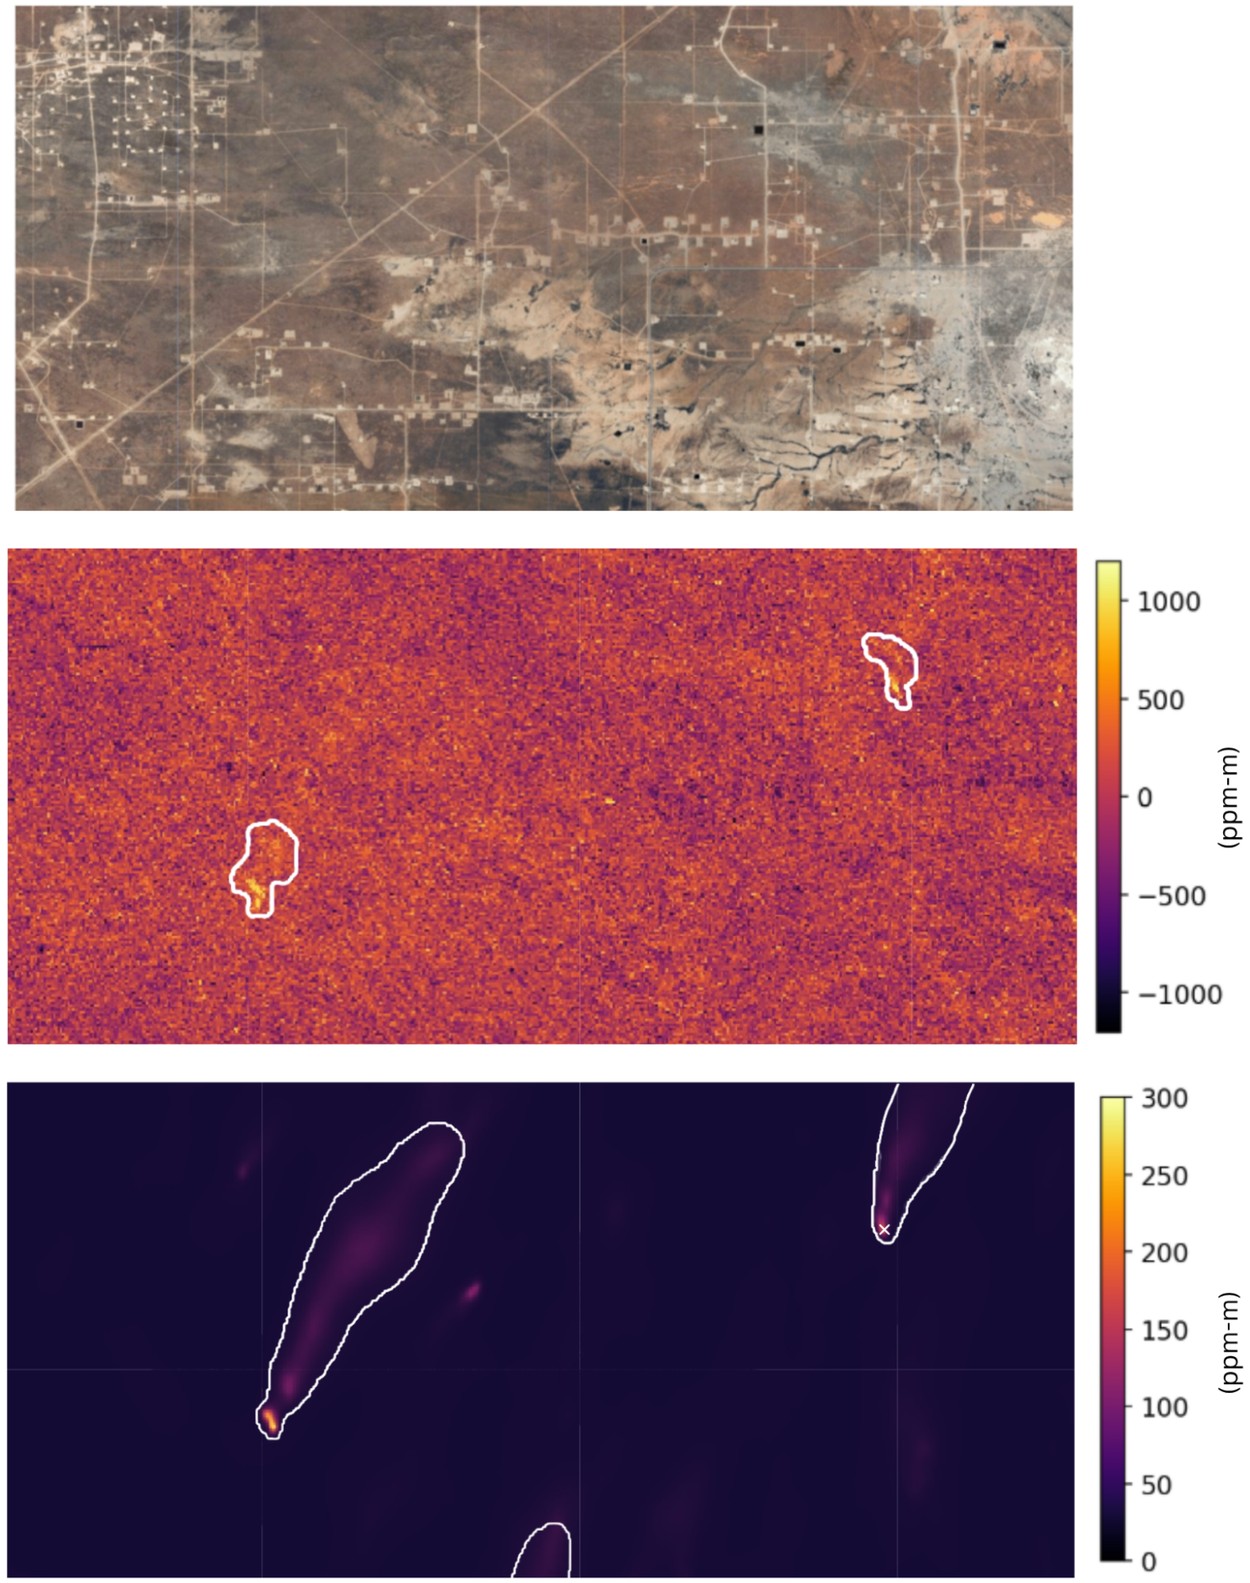
A three-panel graphic showing a standard aerial view, a surface heat map, and isolated gas emission plumes
Source: research.google
Source: research.google
Scaling any of this globally is where it gets hard. Earth's surface is not uniform, and some materials imitate methane's spectral behavior, which is what makes small or diffuse sources so difficult to pull out. Google Research worked with the EMIT team on models that take in the visual context of a whole scene rather than reading it pixel by pixel. The work sits under Google Earth AI, the company's set of geospatial models and datasets.
MAPL-EMIT is built end-to-end on Swin-S, a vision transformer. Instead of treating each pixel's spectrum as an isolated measurement, it considers the full spectrum and the spatial context around the target at the same time. That lets it model how gas actually moves across a landscape, which is how it separates a real plume drifting downwind from a fixed patch of ground with a similar spectral signature. Those patches were the main source of false positives in earlier methods. The spatial view also handles crowded scenes: in industrial areas the emissions of several neighboring sites merge into a single cloud, and the model solves three separate tasks at once, among them reconstructing the shapes of overlapping plumes and marking each source with a cross.
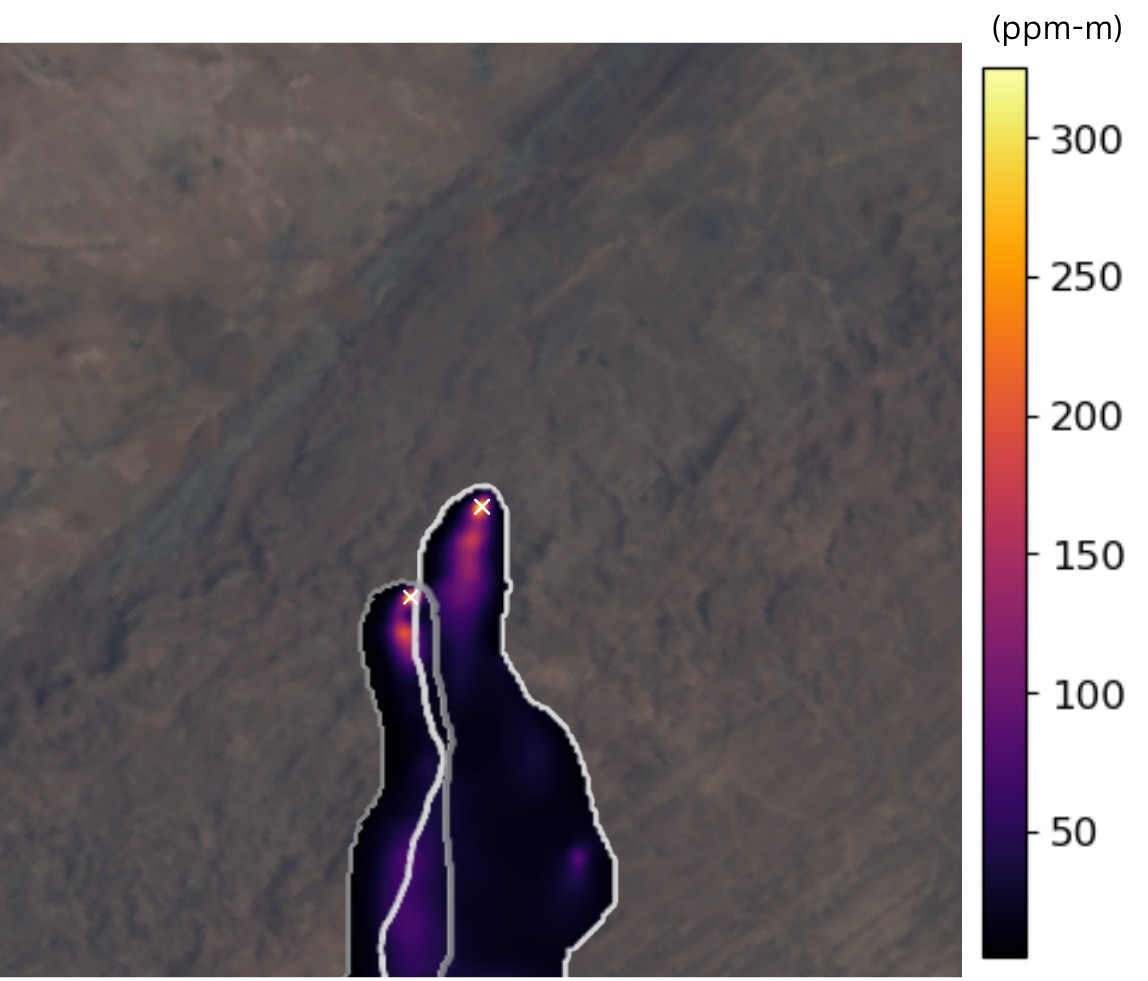
An overlay on a satellite map showing two concentrated emission plumes originating from sources marked with an X
Source: research.google
Transformers need enormous training sets, and a global corpus of millions of labeled real methane releases does not exist. So the researchers built one from physics: 3.6 million synthetic plumes, generated with Lagrangian puff models that reproduce how particles move and disperse in air, then injected directly into real EMIT scenes across a range of emission intensities and turbulent atmospheric states. The chaotic, turbulent behavior of real gas is the part that had to be simulated convincingly for the model to generalize across climates and terrain.
Source: research.google
On real data, the model recovered 84% of the plumes experts had labeled in NASA's L2B reference set, and across roughly 1,100 EMIT granules it flagged about 50% more plumes it judged plausible. Its higher sensitivity picks up weaker emissions, pushing the current detection floor down. In difficult conditions it held up: it mapped plumes at 24 of the 25 largest landfills in the world by emission volume.
False positives remain the open problem, particularly over complex terrain. The team's answer is a physical confidence score for each plume based on spectral agreement, computed from the number of detections during sequential strided inference and weighed alongside other characteristics. Users can set their own balance between catching real plumes and admitting false ones. Because that tuning is awkward, every plume also carries a plain "low" or "high" confidence label so the data can be used as it comes. A time series of detections shows the system tracking plumes from a large landfill in Amman, Jordan.
The 84% is the number that will be quoted, but the 50% is the one that matters, and it is the one that cannot be checked. Those extra detections are, by definition, plumes the expert reference set does not contain; "plausible" is carrying the weight there, and the evidence that they are real comes from a model whose entire sense of what a plume looks like was learned from a physics simulation. That is a defensible way to build a detector and a circular way to validate one. The low/high confidence label is the same admission in friendlier form: the false-positive problem has not been solved, it has been handed to whoever downloads the data, with a suggested default.
The quieter gap is what happens after a detection. The Global Methane Pledge commits its signatories to a 30% cut, not to a map. MAPL-EMIT tells a regulator, a researcher or an operator where the gas is coming from and, thanks to Earth Engine and Kaggle and GitHub, tells everyone else too. Nothing in the release addresses who is obliged to act on a plume once it appears on a public map, and in most of the jurisdictions where those 1,100 granules were captured, the honest answer is nobody in particular. The technical bottleneck is being removed from a problem whose binding constraint was never technical.
The global plume database and an interactive visualization app are on Earth Engine, the trained model and synthetic plumes are on Kaggle, and the inference library is on GitHub. The system pairs Google's machine learning with JPL's domain expertise, and it exists partly in anticipation: NASA is preparing a new generation of imaging spectrometers that will expand coverage by 30 to 50 times.
Source: research.google
That multiple is the real deadline. When coverage grows thirty- to fiftyfold, the number of located, timestamped, publicly visible methane sources grows with it, and so does the number of them that stay open. A map this good stops being a monitoring tool and becomes a ledger of who was told.