A map built around a regulatory cutoff
ForTy divides land into primary forest, naturally regenerating forest, planted forest, plantation, tree crops such as oil palm, rubber and cocoa, and other land. Its authors call it the first map of this kind to cover the entire world; earlier datasets, including a European Commission map, cover only selected regions.
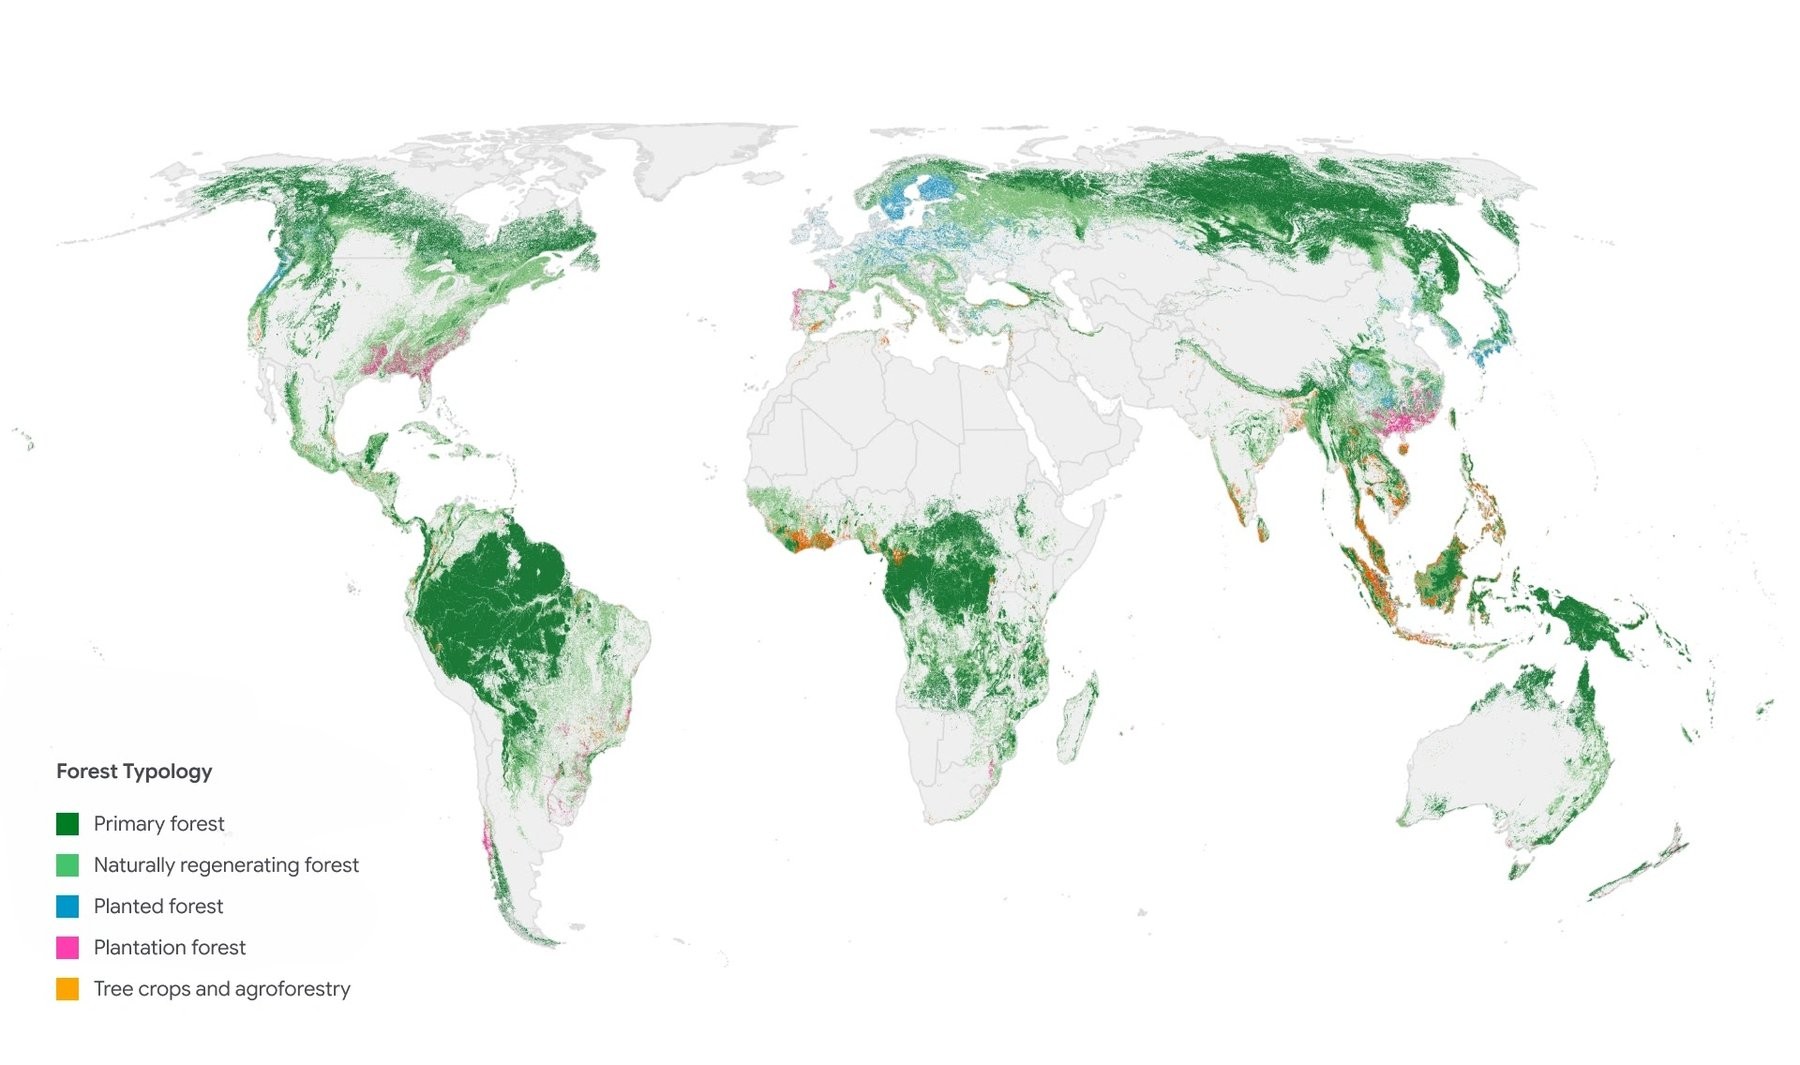
The map shows the most common forest or land use class in each square kilometer, while the underlying data has a resolution of 10 meters. | Image: Google Deepmind
Source: the-decoder.com
The EU Deforestation Regulation (EUDR) prohibits products linked to forests cleared or degraded after 31 December 2020. It also covers products made after primary forest has been converted to a plantation. Because oil palm and cocoa farms count as agricultural land, companies need to know how a plot was used in 2020 to assess supply-chain risks.
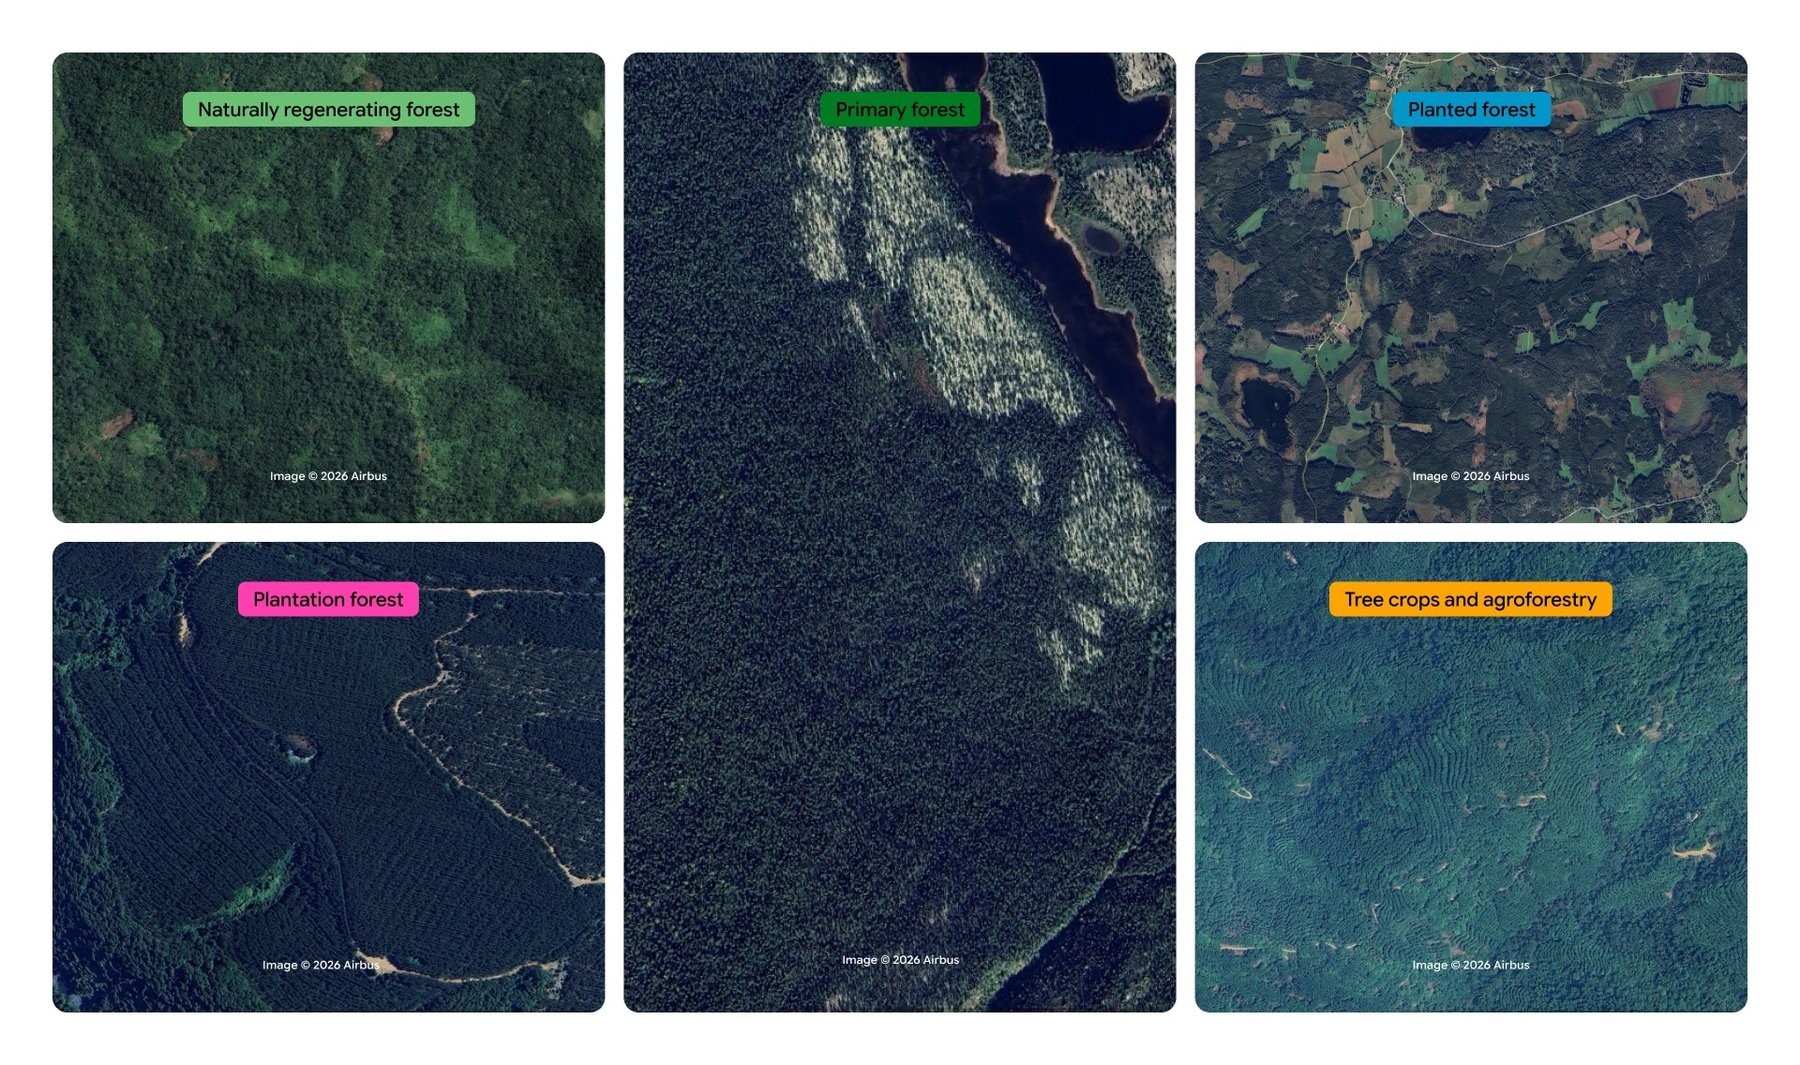
The model distinguishes the 5 visually similar forest and tree crop classes using planting patterns, growth cycles, and harvest schedules. | Image: Google Deepmind
Source: the-decoder.com
ForTy gives them a snapshot for that year. The same kind of data could also support initiatives such as the Tropical Forest Forever Facility (TFFF) and the UN goal of protecting 30% of land by 2030.
Classifying forest type is harder than detecting tree cover. A mixed forest planted long ago can look natural from space; a recently cleared plantation still counts as forest by definition, even when the satellite image shows bare ground.
How ForTy makes its classifications
The system uses Google DeepMind’s AlphaEarth Foundations model, which compresses data from several satellites into a compact description of each pixel. Image-recognition models then classify the land in three stages:
Google’s Gemini language model also helped align older training data with EU definitions.
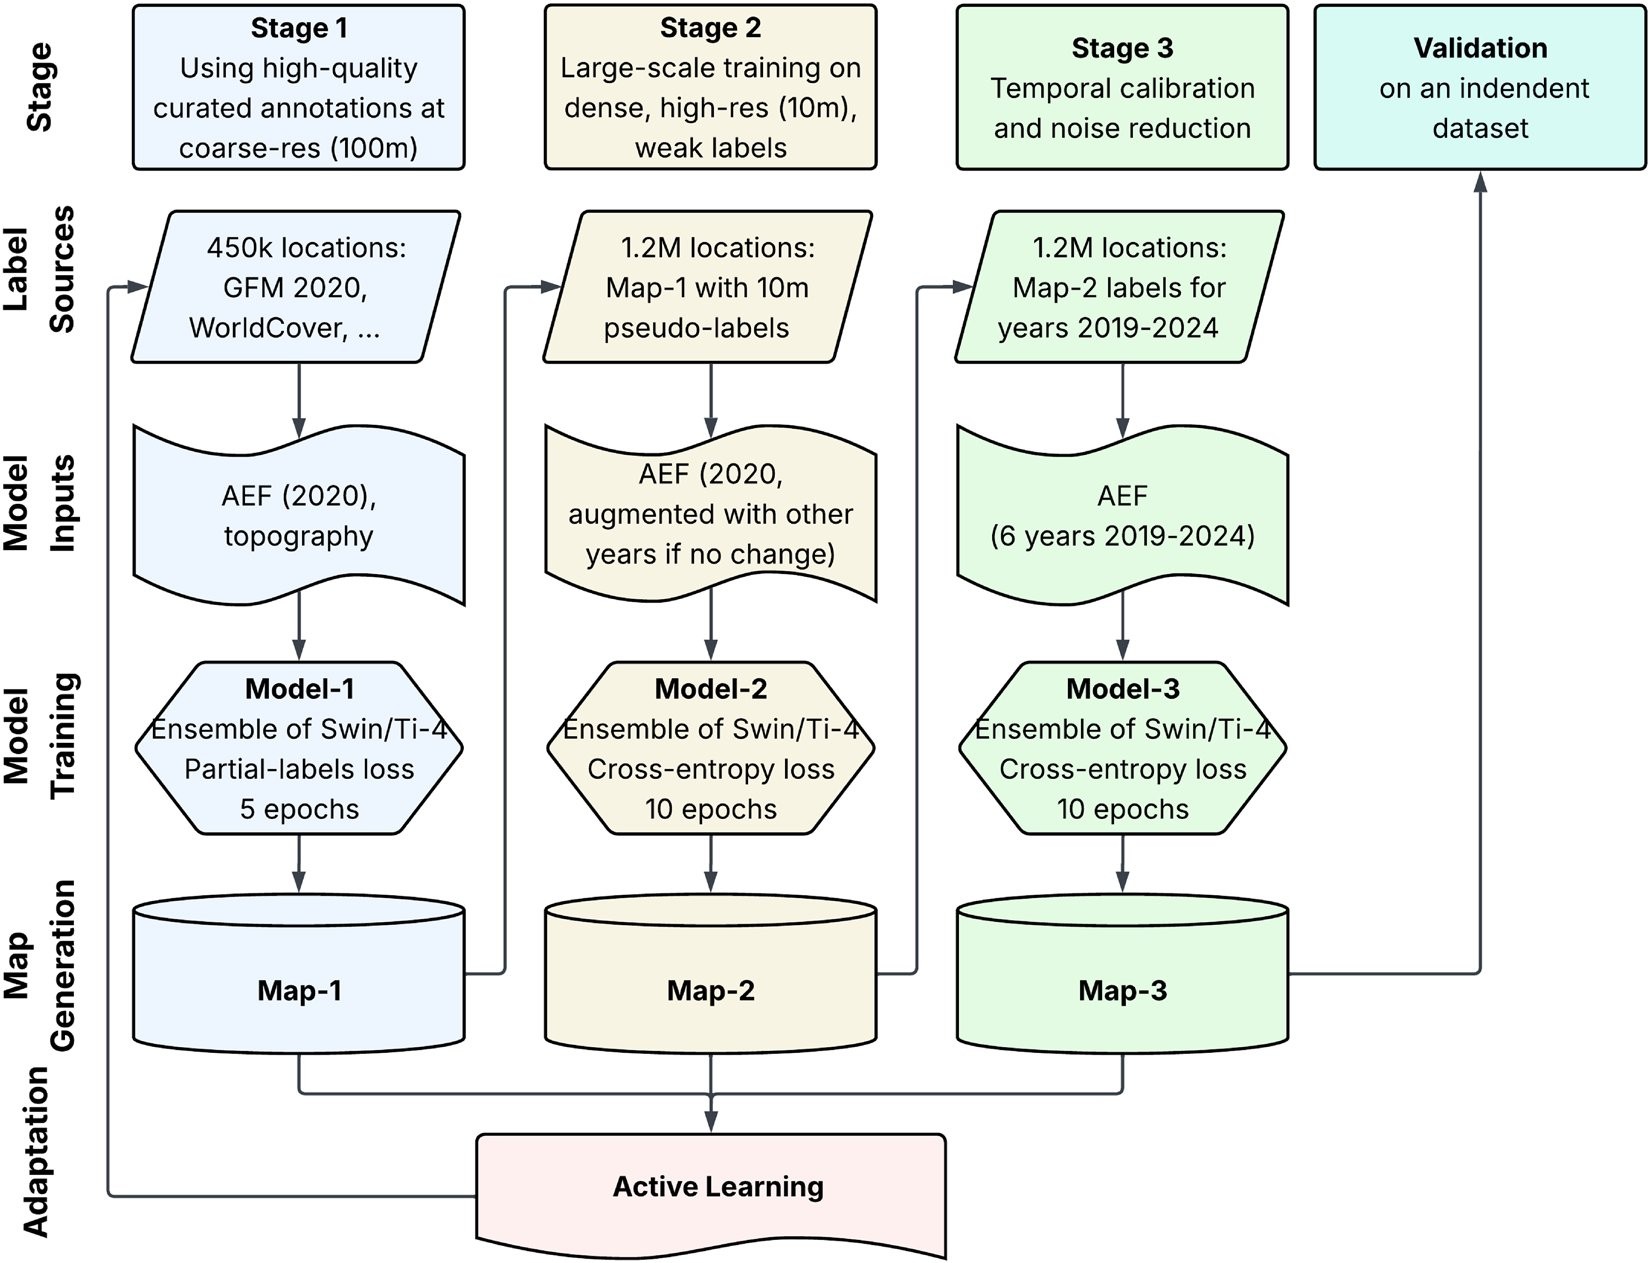
ForTy trains three models that build on one another and specifically improves the training data in multiple active learning rounds where the map showed errors. | Image: Google Deepmind
Source: the-decoder.com
During rounds of error correction, experts added about 43,000 examples. They found European vineyards mistaken for tree crops, natural pine forests in Central America labeled as planted, and oil palms in Africa and Indonesia that the system failed to recognize.
Some distinctions remain difficult to make from satellite images alone. Researchers separate plantations from other planted forests using a 40-year rotation threshold, but say that cutoff does not fit every region.
The headline accuracy has a catch
Two experts assessed each of 8,190 randomly selected plots. For 90.2% of them, the classification was correct. But the authors warn that the overall figure is boosted by “other land,” the easiest class to identify.
Accuracy varied sharply by type:
Among areas labeled as plantations or tree crops, roughly one-quarter to one-third were misclassified. About one in three areas labeled as planted forest was also wrong.
These gaps affect the boundaries most relevant to the EUDR. The evaluation may also overstate performance slightly: experts were most often uncertain about managed land, and the team excluded those cases from the assessment. ForTy nevertheless outperformed European Commission maps created specifically for the regulation on the same test data: 95.5% versus 93.6% for separating forest from non-forest, and 90.9% versus 87.8% for identifying forest types.
The map also inherits a bias in its training data: labelers rarely classified forests near roads and settlements as primary, even when they appeared untouched.
Global totals, uneven errors
Researchers estimate that the world has about 4.1 billion hectares of forest. Nearly 3.9 billion hectares are natural forests, including about 2 billion hectares of primary forest. Planted forests cover roughly 250 million hectares, and tree crops nearly 200 million, mostly in Asia.
But regional errors complicate those totals. ForTy overestimates primary forest in Asia by about 200 million hectares, largely because of Russia’s coniferous forests. In Africa, it misses around 94 million hectares of forest, probably because sparse dry forests and savannas are harder to capture.
About two-thirds of Sweden’s forest area is planted, while natural forests cover only about one-fifth of the country. The authors say overall tree cover may be sufficient, even as the share of natural forests important for biodiversity could be critically low. The Democratic Republic of the Congo, Indonesia and Brazil have the highest shares of natural forest.
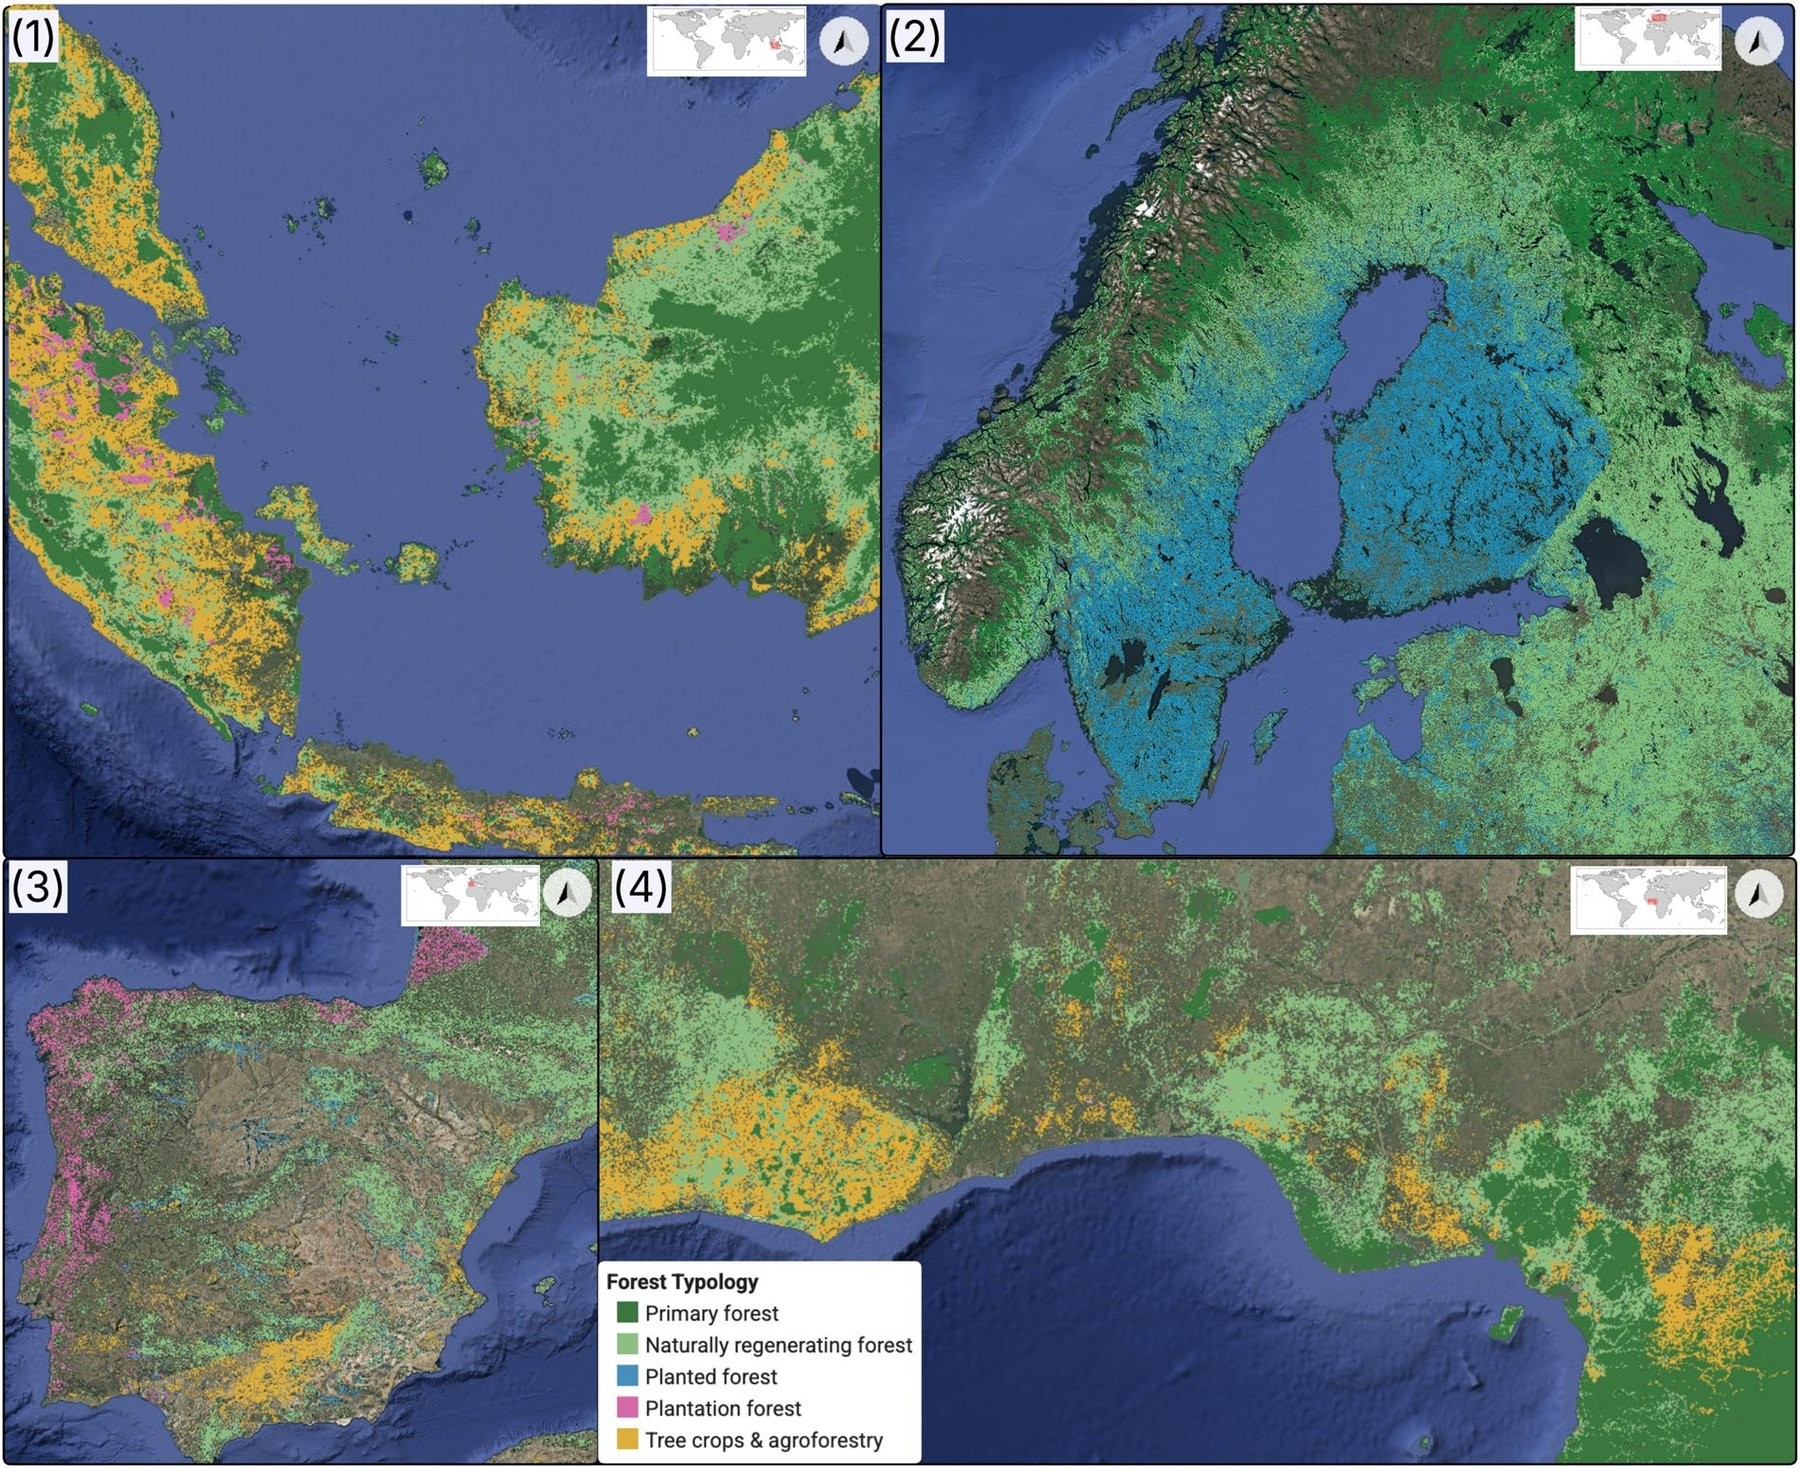
Tree crops and plantations dominate in Southeast Asia, while planted forests account for most of the forest area in Sweden and Finland. | Image: Google Deepmind
Source: the-decoder.com
I think the most consequential limitation is not the headline accuracy, but the map’s difficulty with the categories that distinguish natural forest from managed land. That is precisely where a regulatory snapshot needs to be dependable. What I’d want to know is how often the map gets those boundaries right in the places where companies must make decisions; the reported overall score does not answer that.
ForTy still has known blind spots. Shaded cocoa or coffee plantations beneath a natural tree canopy can be classified as forest, as can selectively logged or burned forests. The map has no separate class for sparse woodlands, though the EUDR treats them separately. The researchers say future versions should add one. Users can set their own confidence thresholds for each class.
The map, classification layer and test data are free under a CC BY 4.0 license, including through Google Earth Engine. Google DeepMind has also published code in the GeeFlow and JEO repositories.
ForTy is one of the first major mapping projects built on AlphaEarth Foundations embeddings. Google introduced the model in July 2025 as a kind of virtual satellite, combining optical imagery, radar, laser scanning and climate simulations into a compact description of each 10-by-10-meter plot. Annual embeddings dating back to 2017 are available free in Google Earth Engine. Google says ForTy is part of its Earth AI work; in autumn 2025, it connected Earth AI with Gemini to speed up detection of floods, droughts and algal blooms.
The map offers a global baseline for a regulation tied to a specific year, but the categories with the greatest policy weight are also among its least reliable. That makes ForTy a starting point for risk assessment, not a substitute for checking the land.
Daily AI news
Every day we pick what actually matters in AI and explain it plainly — no hype, no filler. Subscribe if you want to follow where the industry is going.
Only what matters — every day
Follow on X