
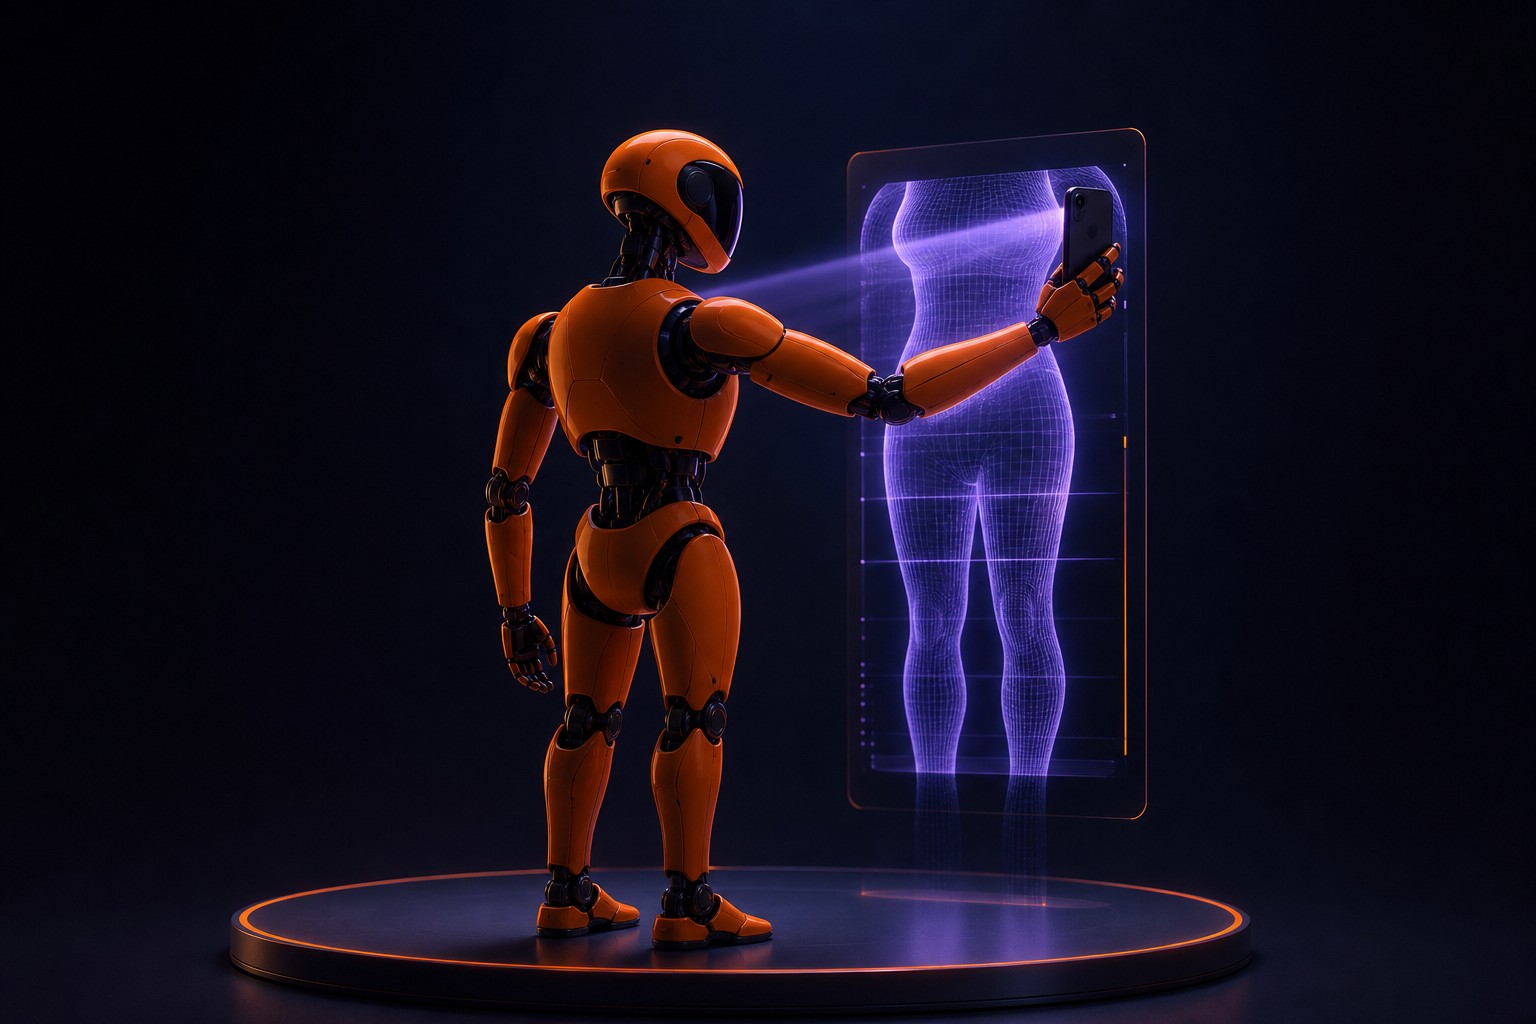
Google Research has built a deep-learning system that reads three-dimensional body composition out of ordinary two-dimensional smartphone photographs, and then uses those readings to flag insulin resistance with accuracy close to a clinical DXA scan. PhotoScan, described by research scientist Cassie Zhou and senior research scientist Ahmed Metwally, was pre-trained on records from more than 35,000 UK Biobank participants and fine-tuned on a separate, diverse cohort of 677 adults. In validation it estimated body fat percentage more accurately than the bioimpedance sensors built into smartwatches, and produced two regional fat ratios those sensors cannot measure at all.
Insulin resistance is one of the main drivers of modern metabolic disease and one of the least frequently caught. Declining insulin sensitivity can precede type 2 diabetes by years, quietly degrading vascular health, liver function and energy metabolism long before fasting glucose crosses a diagnostic line. The standard way to quantify it is HOMA-IR, a homeostatic model of the relationship between hepatic glucose production and insulin secretion under stable fasting conditions; epidemiological reviews put the insulin-resistance threshold above 2.9. Recent work has shown that multi-agent systems combining wearable data with routine lab panels can predict HOMA-IR and surface early metabolic risk.
Body composition adds something wearables do not have. A watch tracks day-to-day physiology; composition gives a structural read on where adipose tissue actually sits. Body fat percentage is the crude version — the ratio of fat to lean mass. The trunk-to-hip fat ratio, A/G, says whether fat accumulates in the upper body, the apple shape, or around the hips, the pear. The visceral-to-subcutaneous fat area ratio, V/S, separates the metabolically active fat wrapped around internal organs from the fat sitting under the skin. Elevated A/G and high visceral fat mass both track closely with insulin resistance.
The reference method for all of this is dual-energy X-ray absorptiometry. DXA is accurate and badly suited to routine screening: it is expensive, it needs dedicated clinical infrastructure, and it carries a small radiation dose. That is the gap PhotoScan is aimed at. The pre-trained model estimates composition metrics from the photographs, those metrics are combined with the user's demographic data, and the result goes to an insulin-resistance classifier. Body geometry comes straight out of the image, which removes the clinical measurement step entirely.
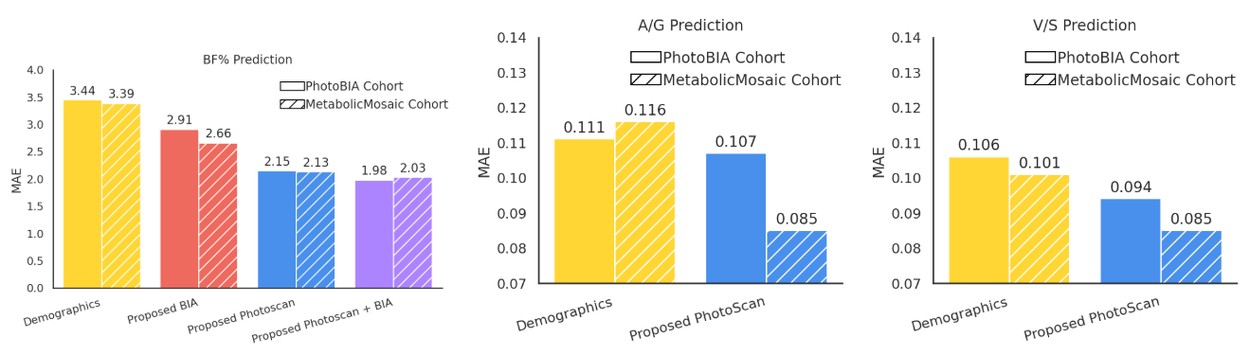
On the PhotoBIA cohort, under five-fold cross-validation, the fine-tuned model reached a mean absolute error of 2.15 on body fat percentage. The bioimpedance-based model managed 2.91. Mean MAE was 0.107 for A/G and 0.094 for V/S. On the independent MetabolicMosaic cohort the numbers held: 2.13 for body fat percentage, 0.085 for A/G and 0.085 for V/S. The slightly tighter regional ratios in MetabolicMosaic track a difference in the cohorts themselves — 67% women against 57% in PhotoBIA. Women tend to have lower absolute A/G and V/S values because fat accumulates preferentially around the hips and under the skin, so the spread of regional ratios, and the prediction error with it, is smaller.
Source: research.google
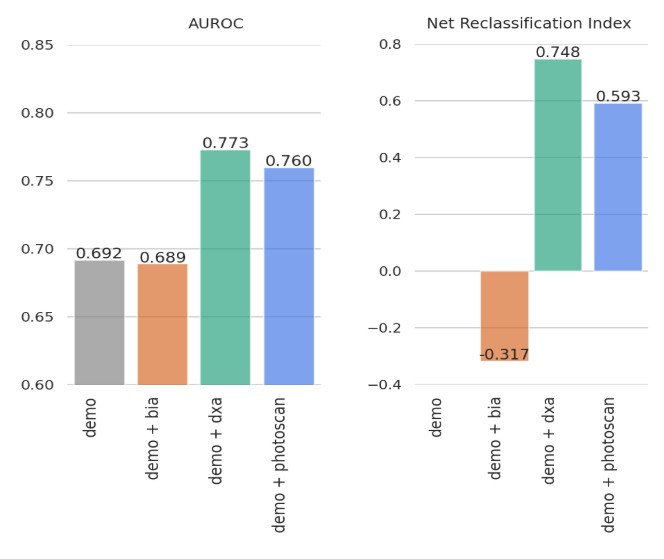
The second phase is the one that matters clinically. The researchers fed a classifier built by sequentially boosting weak models five escalating feature sets and measured what each one bought: demographics alone, meaning age, sex and BMI; standard tape-measure anthropometrics; smartwatch bioimpedance; PhotoScan composition metrics; and finally DXA. Testing ran on MetabolicMosaic, repeated many times on previously unused data to rule out leakage, with validation groups balanced for body mass index and insulin-resistance status. Two metrics: AUROC, which measures how cleanly the model separates an insulin-resistant person from one who is not, and the net reclassification index, which measures how much the new digital inputs move people into the right category relative to the baseline.
Demographics alone scored AUROC 0.692. Adding PhotoScan features took it to 0.760, with an NRI of 0.593. DXA, the clinical reference, reached 0.773 and 0.748. Bioimpedance added nothing to either metric — no AUROC gain, no NRI gain. BIA only estimates body fat percentage, and in the PhotoScan model the features doing the work were A/G and V/S.
Source: research.google
Two things in that table deserve more attention than the headline comparison. The first is that the entire distance between knowing someone's age, sex and BMI and putting them through a radiological scan is 0.081 of AUROC. That is the ceiling, and it is not a high one. PhotoScan covers roughly 0.068 of it from a photograph. Read one way, the phone is nearly as good as the scanner. Read the way I would read it, the scanner was never that far ahead of three demographic variables in this cohort, and the argument for the photograph is not that it approaches DXA but that its marginal gain is nearly free while DXA's is not. The NRI gap is wider — 0.593 against 0.748 — and it is the honest number to quote.
The second is the bioimpedance result, which is the quietest finding here and the most commercially awkward. Body fat percentage from a wrist sensor is a shipping consumer feature in smartwatches sold today. In this study it moved the classifier zero. Not marginally, not within noise of a small gain — nothing. A photograph of the same person, taken on the same phone that syncs the watch, carried real signal, because the signal was in fat distribution rather than fat quantity. The watch cannot see distribution, and no firmware update changes that.
What the write-up is quiet about is deployment. Photographs were collected on Pixel phones, which is a single hardware family under presumably consistent instructions; nothing here speaks to other cameras, other lighting, other clothing, other poses, which is the entire surface area of a real consumer rollout. The longitudinal arm included 132 people. And the privacy shape of this is different from anything wearables have raised so far: the system converts a full-body photograph into a clinical risk label, and a full-body photograph is far more identifying, and far more sensitive to most people, than a number on a watch face. The paper says nothing about where that image would live. It remains a research prototype, and the authors frame the next step as fusing composition with continuous wearable data, glucose dynamics and blood biomarkers.
The work was conducted using the UK Biobank resource under application 65275. Smartwatch bioimpedance readings were compared against DXA; the study was IRB-approved under Pro00065782, and the longitudinal study under 20241060.
The finding underneath all of this is a rebuke to BMI, and the authors say so plainly: traditional anthropometrics can miss clinically meaningful differences in body composition. But the constraint on cheap metabolic screening was never really the sensor. It was whether people will let themselves be photographed for it, and who ends up holding the photograph. PhotoScan has solved the measurement problem well enough to make that the live question.