

Source: research.google
How the watch estimates blood pressure
More than a billion people worldwide have hypertension, or high blood pressure, and more than half of adults with the condition are unaware of it. The disease often causes no obvious symptoms, so it is discovered during routine examinations. The gap is especially pronounced among people aged 18–44: a missed diagnosis can delay early intervention and increase the long-term risk of stroke or heart failure.
Measuring blood pressure in a clinic remains the primary way to detect hypertension. Cuffless devices can supplement these occasional measurements, but commercial solutions typically require regular calibration with a conventional cuff. As a result, they track changes relative to a baseline reading rather than determine whether someone has hypertension.
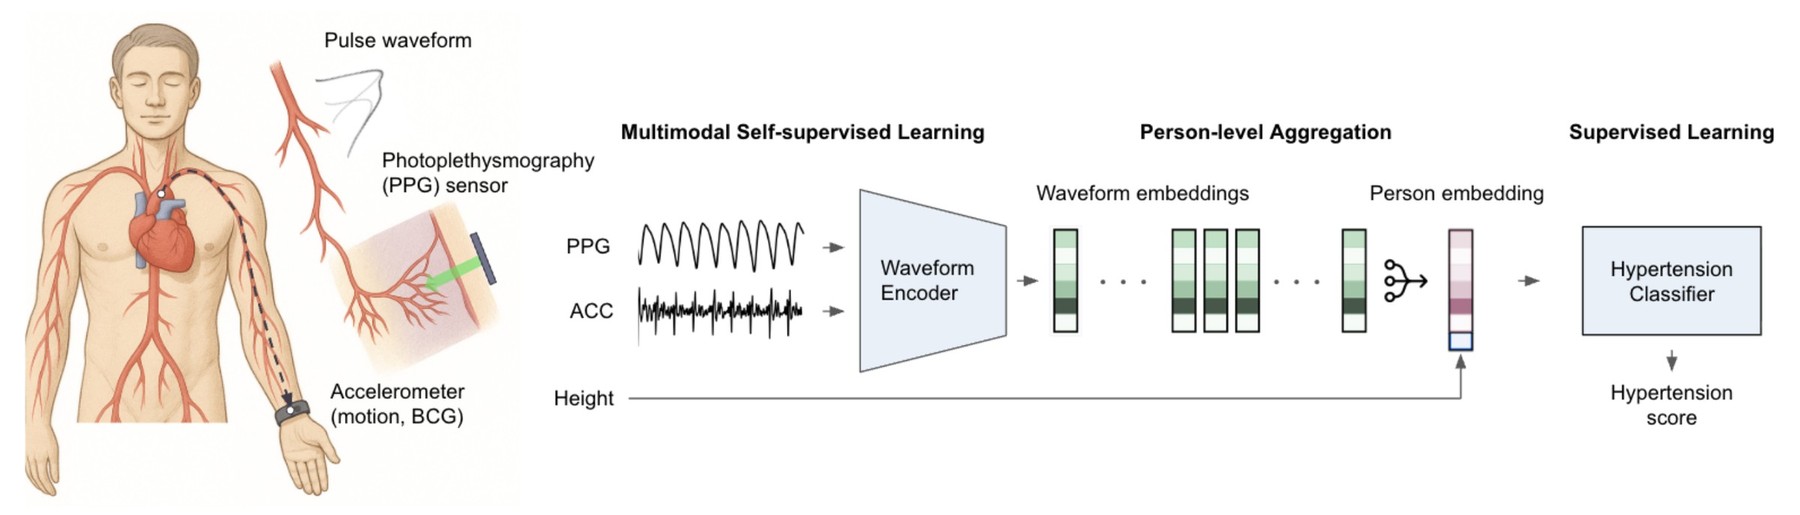
AI-PPG-ACC-HTN works differently: it does not try to estimate an individual systolic or diastolic reading, which can be affected by temporary conditions. Instead, the system accumulates physiological signals over several days to assess a person’s underlying state. It uses two smartwatch sensors:
Signals from both sensors are converted into vector representations of their waveforms. They are then combined across days into a representation of the person; together with the user’s height, it is fed into a model that estimates their blood pressure status.
Two stages of training
In the first stage, researchers trained a one-dimensional deep convolutional neural network using contrastive self-supervised learning. They used 492,347 hours of sensor data from 2,109 participants who had consented to the study. The model brought overlapping 15-second PPG and ACC segments from the same person closer together in its latent space. This allowed it to learn patterns in vascular and cardiac mechanics without manually selected features or medical labels.
In the second stage, 15-second segments were averaged across several days of watch use. This helped smooth out short-term noise, such as sudden movements or temperature changes. The resulting representation was combined with the person’s height, which served as an indirect indicator of arterial path length, and passed to a regularized logistic regression model. The output was a continuous estimate of the probability of hypertension.
Testing in a clinical study
The system was tested in a prospective, multicenter study at five sites in the United States. It included 196 people with varied characteristics who had no known cardiovascular disease and were not taking blood pressure medication. Watch results were compared with 24-hour ambulatory blood pressure monitoring (ABPM), the clinical standard for diagnosing hypertension. Researchers evaluated two scenarios: initial screening and diagnostic confirmation.
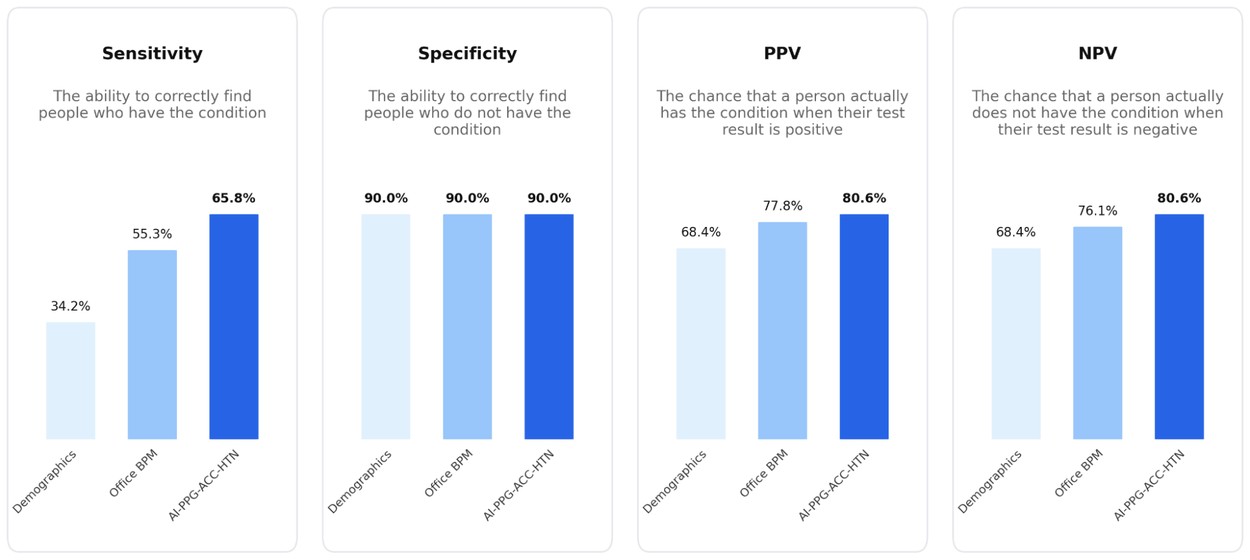
In initial screening, the system’s sensitivity was 65.8%, specificity was 90.0%, and positive predictive value (PPV) was 80.6%. For an initial blood pressure measurement in a clinic, sensitivity was 55.3% and PPV was 77.8%.
For confirmatory testing, researchers examined 48 participants whose initial clinic measurement showed elevated blood pressure. The watch had a sensitivity of 78.4%, specificity of 90.9%, and PPV of 96.7%. A repeat clinic measurement produced lower figures: 67.6% sensitivity, 63.6% specificity, and 86.2% PPV. Multi-day home monitoring had a sensitivity of 89.2%, specificity of 81.8%, and PPV of 94.3%.
Source: research.google
Overall, the system’s results were comparable to those of traditional cuff-based devices in current clinical practice.
Which signals are linked to risk
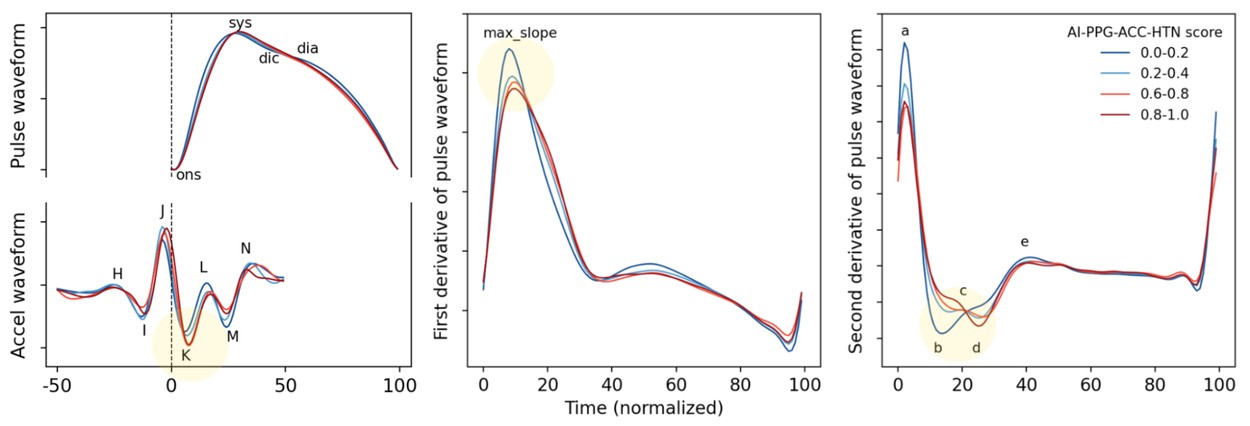
Researchers compared average pulse waves from people with the highest and lowest estimated probabilities of hypertension. At higher estimated probabilities, pulse-wave width was slightly narrower. This indicates smaller changes in blood volume and may be associated with stiffer arteries that expand less easily.
Higher estimates were also associated with a slower initial rise in the systolic part of the wave and a lower d/a ratio. This measure compares the first pulse wave with the reflected wave returning from the vascular system. The accelerometer also captured differences in the ballistocardiogram: people with higher estimates had deeper K-waves and wider IJK complexes.
Source: research.google
In the charts, researchers showed average pulse waves, accelerometer signals, and the first and second derivatives of the pulse wave for four participant groups with the most extreme AI-PPG-ACC-HTN estimates. They marked characteristic signal points: pulse onset, the systolic peak, the dicrotic notch, and the diastolic peak in PPG; the H, I, J, K, L, M, and N waves in BCG; and the a, b, c, d, and e waves in the second derivative of PPG.
Early research, not a diagnosis
The developers do not propose replacing standard cuff measurements with watches or using them as a standalone way to make a diagnosis. The work assesses the early feasibility of passive screening: watches could help identify signs of risk and prompt someone to seek a full clinical assessment. The authors stress that the methods are experimental and do not describe an existing or future commercial feature or device capability.
The study involved Google Research, Beth Israel Deaconess Medical Center, and Harvard Medical School. The paper’s co-authors include Lawrence Kai, Jiang Wu, Mingwu Gao, Bhavna Daryani, Jonathan Wang, Utkarsh Khanna, Ho Ko, Anupam Pathak, Mark Malhotra, Shwetak Patel, Jacqueline B. Shreibati, Stephen P. Juraschek, Pramod Rudrapatna, and Matthew Thompson. Key project contributors named include Jennifer Block, Anu Gabbita, Sushalini Sunku, Kirthana Natarajan, Alexandros Pantelopoulos, Tuan Phan, Tracy Gist, and Florence Tng.
Dataist’s take: The study shows how sensors already found in smartwatches can be used to identify people who may benefit from clinical screening. But the results so far support the potential for screening, not replacing cuff-based blood pressure measurement or diagnosing someone without a doctor.
Daily AI news
Every day we pick what actually matters in AI and explain it plainly — no hype, no filler. Subscribe if you want to follow where the industry is going.
Only what matters — every day
Follow on X