From solar wind to local risk
Space-weather forecasting links several systems whose effects vary across time and place. The solar wind changes quickly; its interaction with Earth’s magnetosphere is irregular; and local geology and grid characteristics shape what happens at the surface. Poorly conducting bedrock can amplify geomagnetically induced currents, while latitude and transmission-line orientation also affect the impact on individual sites.
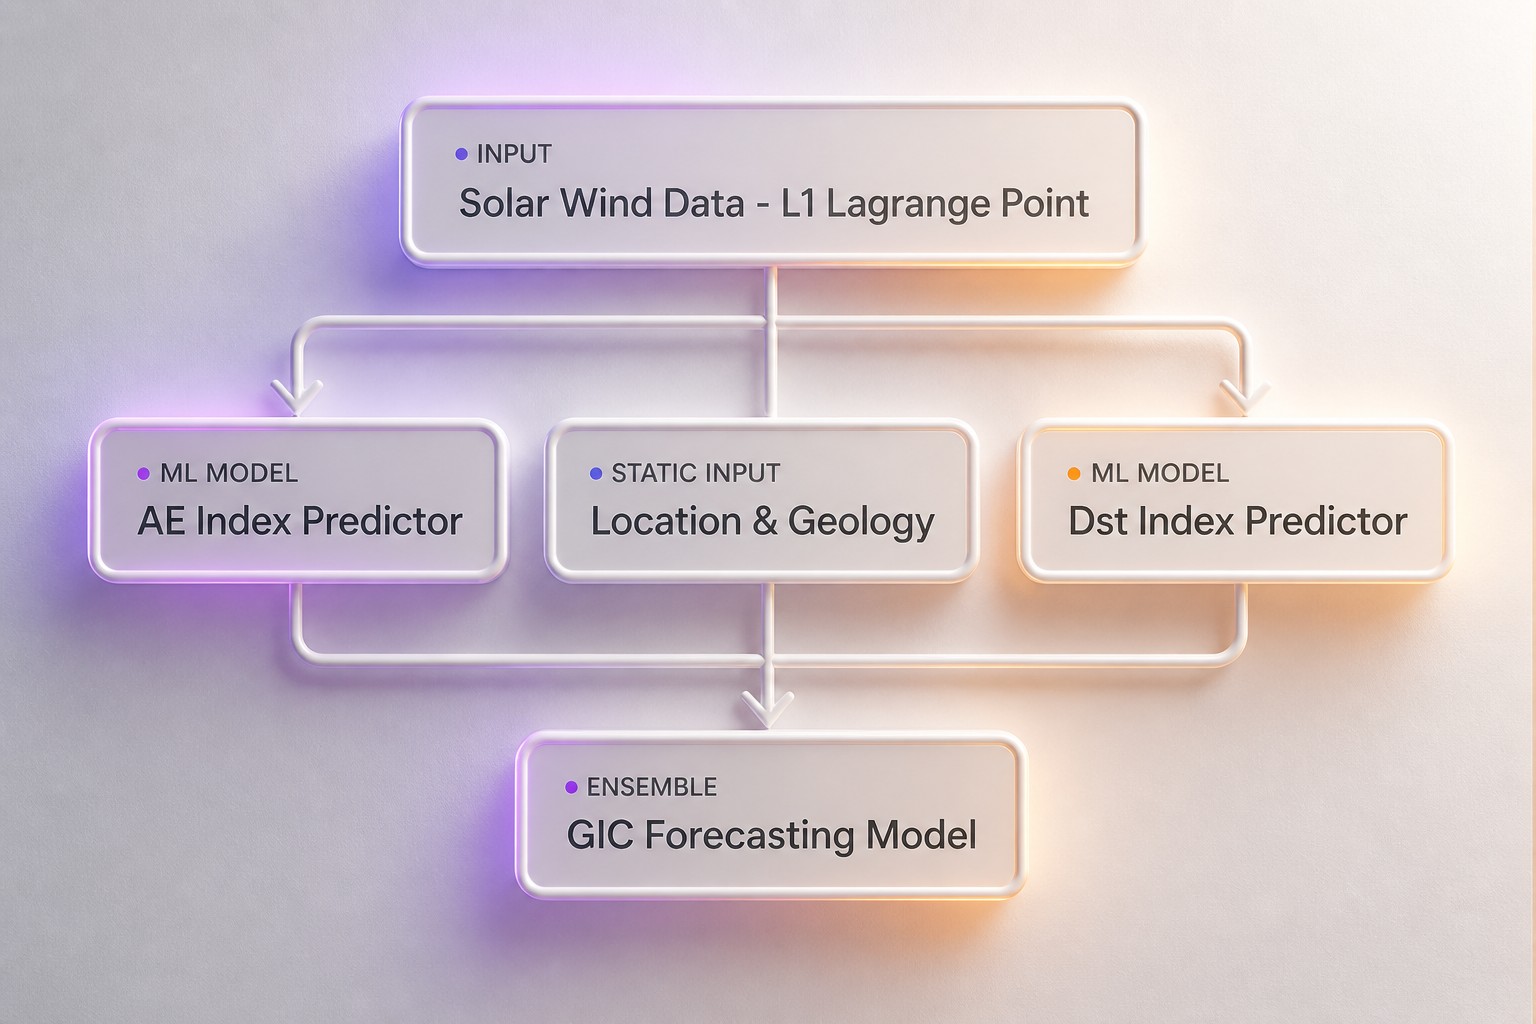
The pipeline has three stages:
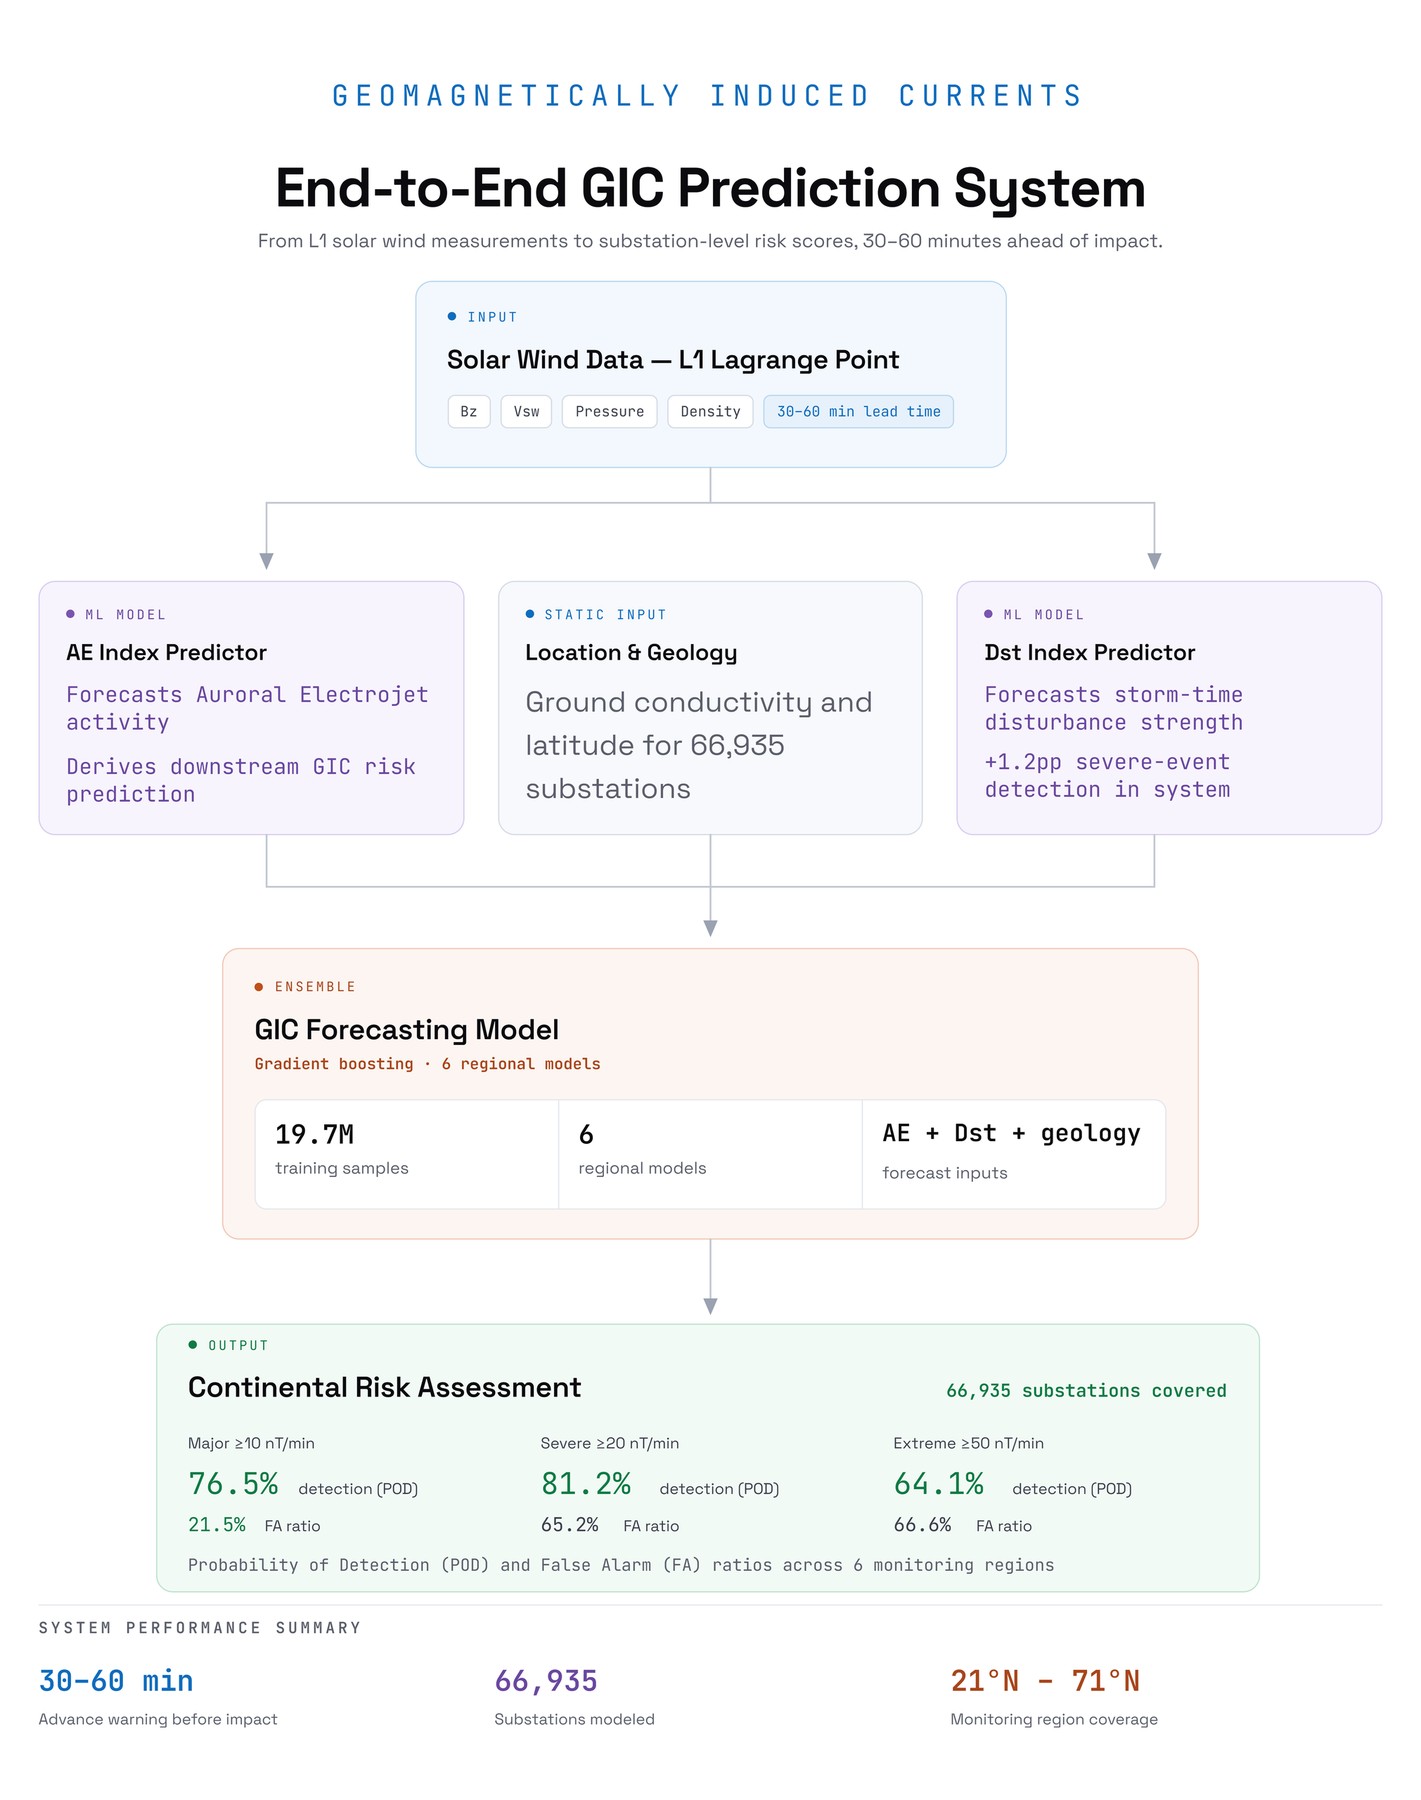
Figure 1. End-to-end forecasting pipeline from L1 solar-wind measurements to location-specific risk estimates across 66,935 U.S. substations.
Source: microsoft.com
Fifty AI agents helped develop features, validation methods and model settings across the pipeline. The project used open data sources, including NASA OMNI, Kyoto World Data Center data aggregated by NASA, magnetometer observations from INTERMAGNET and the U.S. Geological Survey, and grid data obtained from GridSFM.
What the evaluation shows
The AE model was built to forecast rare but intense geomagnetic activity that can threaten infrastructure. From 2020 to 2026, it produced forecasts across nearly the full observed AE range and outperformed several empirical methods based on solar-wind data.
The Dst model added a broader measure of storm intensity. During the most active geomagnetic periods from 2020 to 2026, it outperformed the Burton equation in 62.2% of individual hours. Combined with AE forecasts, it improved detection of strong events in the full pipeline by 1.2 percentage points.
For the GIC-risk stage, the researchers compared the model with simple linear regression; they say there is no widely used operational system for a direct industry comparison. The system detected:
False alarms increased as storm intensity rose, reflecting a trade-off between missed events and more cautious warnings. Detection was strongest at northern stations, where geomagnetic activity is more intense.
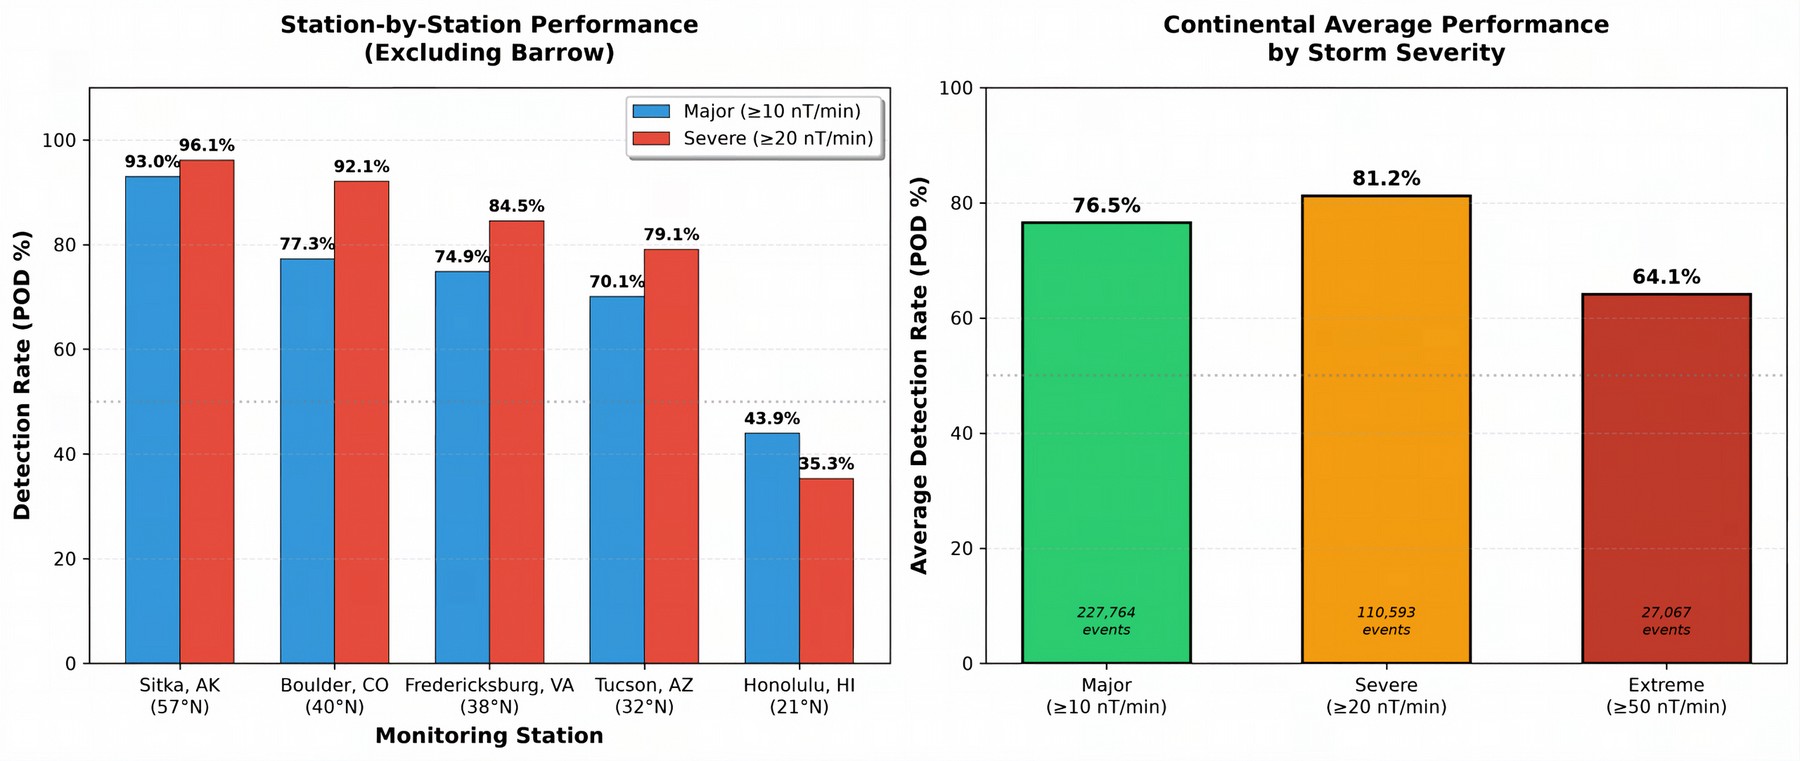
Figure 2. Detection rates across storm-severity thresholds for regionally different substations, with a comparison between the average POD for each severity tier.
Source: microsoft.com
A map, not a grid-control system
The final stage turns geomagnetic forecasts into local dB/dt estimates, accounting for storm conditions, each substation’s latitude and local geology. Rather than issue one alert for the entire continental United States, the system creates a continuous map that distinguishes lower-risk areas from places where poorly conducting geology could intensify surface effects.
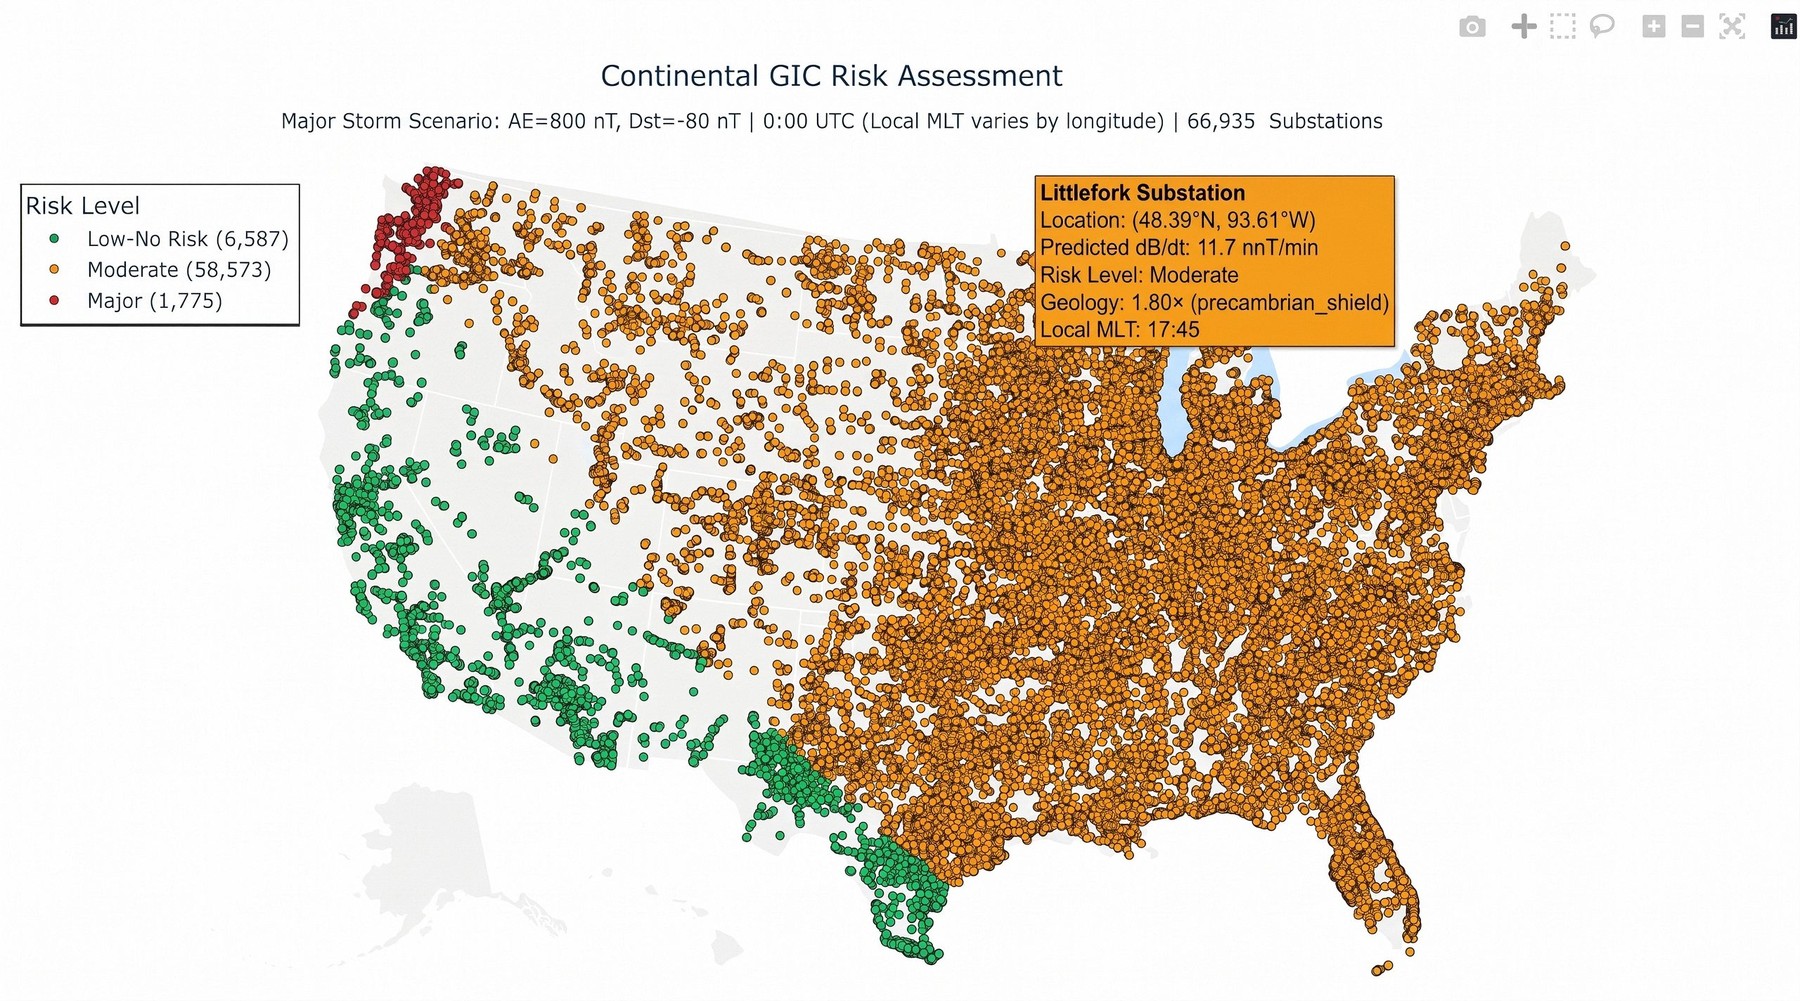
Figure 3. Demonstration of a continental GIC risk assessment under a representative major-storm scenario. Colors indicate modeled risk levels across 66,935 substations.
Source: microsoft.com
The illustrated major storm is a continent-wide simulation, not a record of an event on an operating power grid. The map could help identify locations for closer analysis, but it does not establish how utilities would act on the estimates. In an inference measurement, the current pipeline calculated scores for all 66,935 substations in about 333 milliseconds.
I think the most meaningful result is the shift from a general storm warning to a location-specific estimate. The limits matter just as much: the GIC model is benchmarked against a simple regression, and the project says further validation with utilities and operational data is needed before the system can be used in grid management. The announcement does not say how its alerts would fit into existing engineering reviews or how often false alarms would be acceptable.
The work sits alongside other Microsoft research on AI for power grids. An open grid-data pipeline provided realistic models of U.S. transmission networks, while GridSFM applies deep learning to AC optimal power flow for faster scenario analysis. The researchers’ next steps include extending the forecast horizon beyond 30–60 minutes, adapting the system to other regions, connecting forecasts to existing utility decisions and assessing risk for individual transformers.
That is the gap between a fast map and an operational tool: local forecasts may help utilities prioritize inspections and consider measures such as adjusting reactive-power reserves or temporarily reconfiguring parts of the grid, but the project has not yet shown how those estimates perform inside utility workflows.
Source: microsoft.com
Daily AI news
Every day we pick what actually matters in AI and explain it plainly — no hype, no filler. Subscribe if you want to follow where the industry is going.
Only what matters — every day
Follow on X