CoDA's agents grade their own charts, lifting MatplotBench from 55 to 79.5

Turning a plain-language request into a correct chart is harder than it looks. The data is large and heterogeneous, the code breaks often, and a good chart almost always takes several rounds of edits. Researchers at Google argue the task should not be treated as one-shot code generation by an LLM, but as the coordinated work of a multi-agent system in which every role does its own job and hands off to the next.

What the authors built
CoDA's core idea is to work from metadata rather than raw data, and to keep checking itself against the rendered image the way a person would. That keeps the context window from overflowing and lets the system work confidently across many files and formats. Inside is a chain of agents: some read the task and draft a plan, others retrieve examples and generate code, others debug, and a final reviewer grades the image and sends feedback back for another pass.

How it works in practice
- Understanding. The agent extracts the intent behind the request, builds a global to-do list and sets the criteria for success. In parallel it takes a metadata snapshot: table schemas, basic statistics, likely data-quality problems.
- Planning. A second agent maps the meaning of the request onto a chart type, axes, color, aggregations and transformations. A retrieval agent pulls in relevant code examples — from the Matplotlib gallery, for instance — and a designer sets the palette, the layout and the readability.
- Generation. Executable Python code is written with checks built in, then run and debugged automatically.
- Self-reflection. A separate visual examiner studies the finished image: does the data actually answer the request, is the math right, is everything legible and clean. If not, it produces specific edits, and the loop repeats until a quality threshold or an iteration limit is hit.
Why it beats earlier approaches
Many earlier systems leaned on hand-written rules. On complex, multi-file data those approaches run into token limits and get lost in ambiguity. CoDA splits the task across roles, works from metadata, checks the rendered image strictly, and knows how to roll back deliberately to the right point in the pipeline: a syntax error goes to the debugger, a clarity problem to the designer, a mismatch with intent to the planner.
What the experiments showed
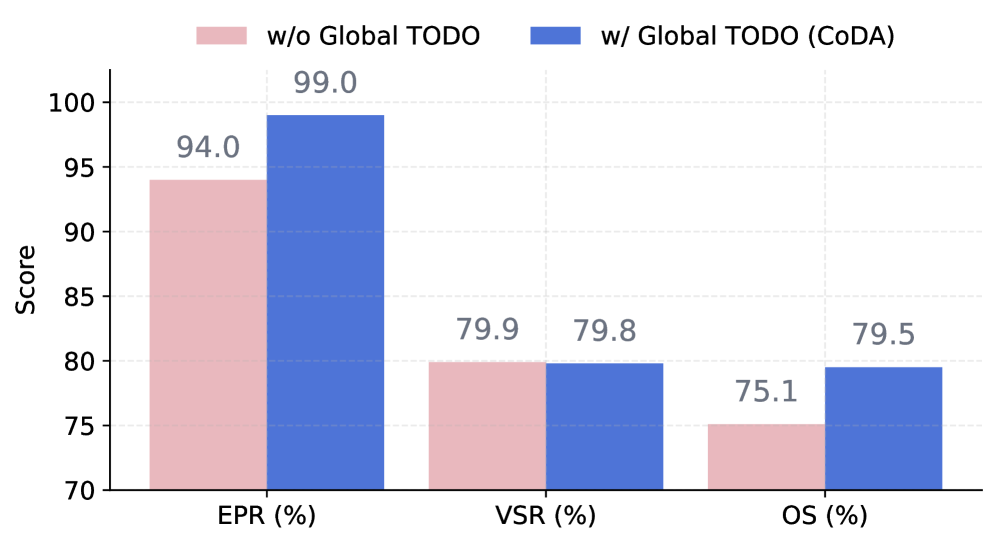
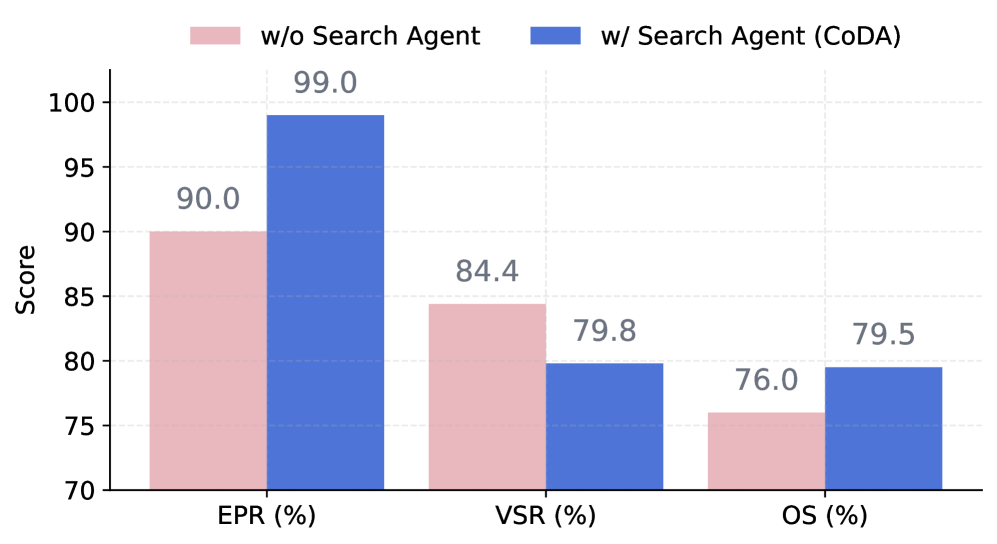
On MatplotBench, CoDA reaches EPR 99.0, VSR 79.8 and an overall score (OS) of 79.5, well ahead of the alternatives — the best baseline on OS is 55.0. On the Qwen Code Interpreter (vis) set it scores OS 89.0 against 81.6 for the nearest competitor. The gain in overall score runs as high as 41.5% over strong methods, depending on the comparison and the dataset. On DA-Code, a set of real tasks where the system has to live inside someone else's repository and respect domain constraints, CoDA posts OS 39.0% and beats the best baseline by almost 20 points. Swapping the backend LLM barely moves it: OS falls by a few percent at most, a sign that the architecture compensates for the model's weaknesses through cooperation and metadata.
Why it works
Three factors contribute the most:
- iterative self-reflection on the rendered image;
- the global TODO, which keeps the solution focused and complete;
- the example-retrieval agent, which cuts syntax errors on non-trivial charts.

Mini-cases from the appendix
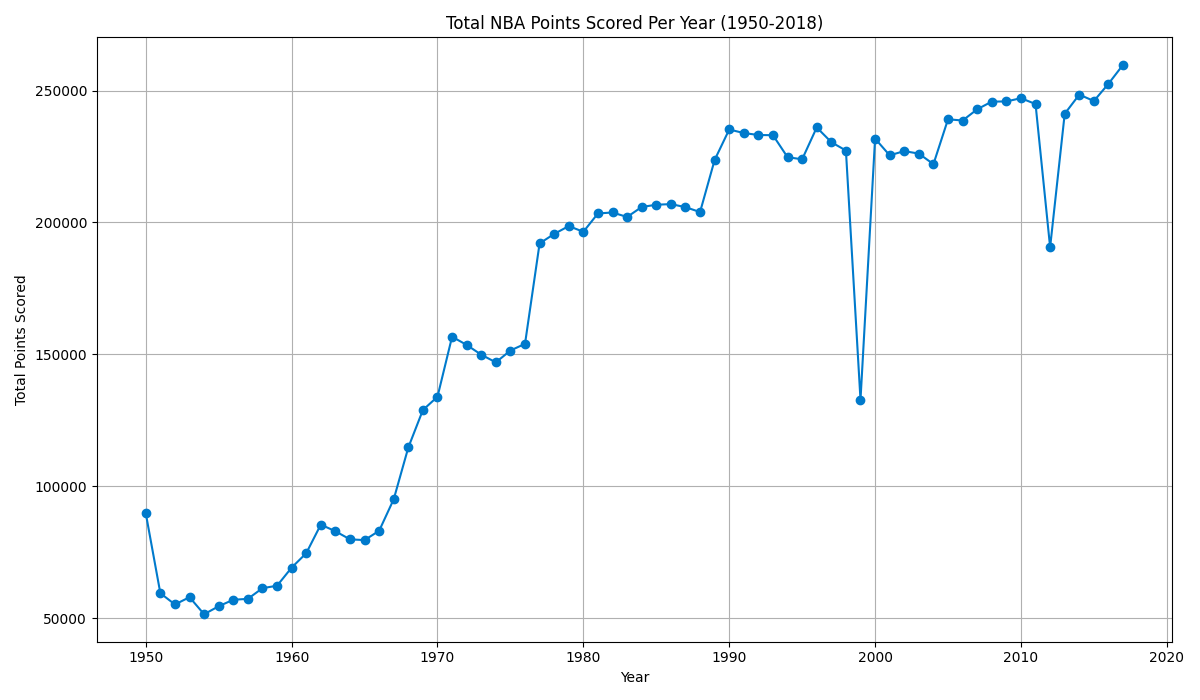
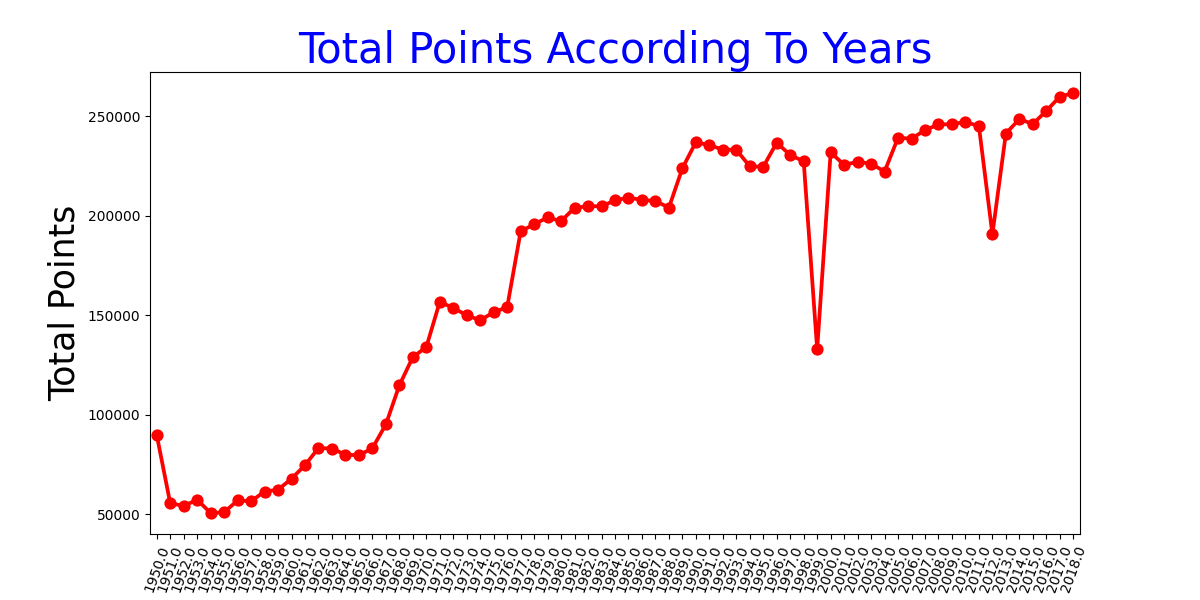
The system correctly reconstructs metrics that are not in the data directly. In the NBA example, "total points per season" is assembled by aggregating over players and years, and the resulting chart matches the reference.
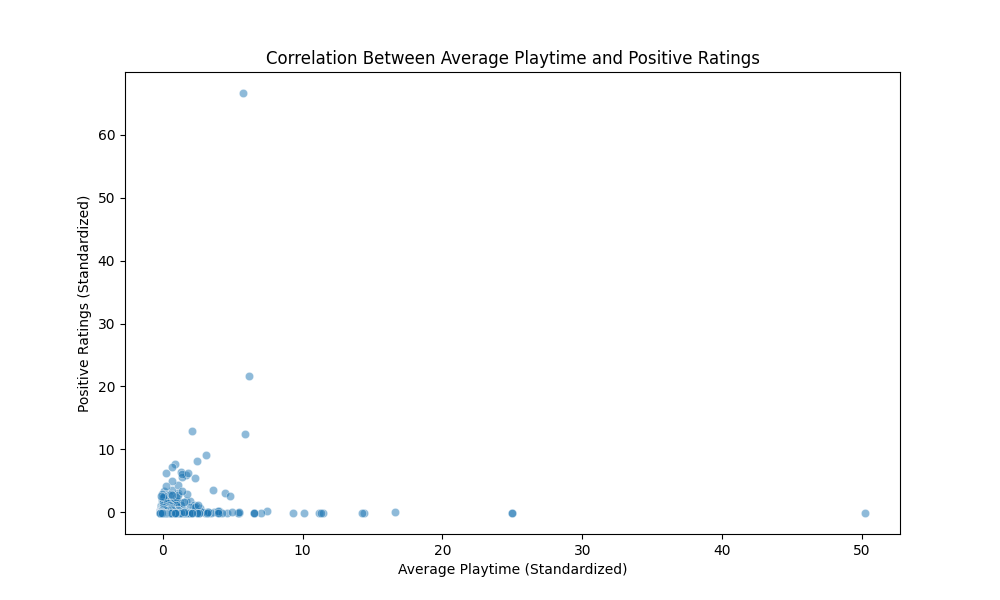
In the Steam case, CoDA standardizes the measures, computes a Pearson correlation and builds a readable scatter plot using settings drawn from a config file — again an exact match with the target.

The practical cost
This coordination does cost compute: more tokens and more LLM calls than very simple pipelines. Even so, CoDA came out cheaper than comparably heavy single-agent solutions while delivering a clear quality gain on hard scenarios. Optimization is on the authors' roadmap: distilling the roles and adding multimodal inputs to make the approach cheaper and more widely usable.
Where this leads
The authors state their point plainly: the future of visualization automation lies not in isolated code generation but in integrated agentic workflows. A system that understands its data, knows how to doubt itself and can correct course gets closer to how a working analyst actually operates.
AI paper breakdowns
Every day we read the new AI papers and retell what matters in plain language — no hype, no filler. If you want to see where AI agents are heading before everyone else, subscribe.
New breakdowns every day.
On Telegram