TSci's four agents cut forecast error 10.4% over statistical baselines
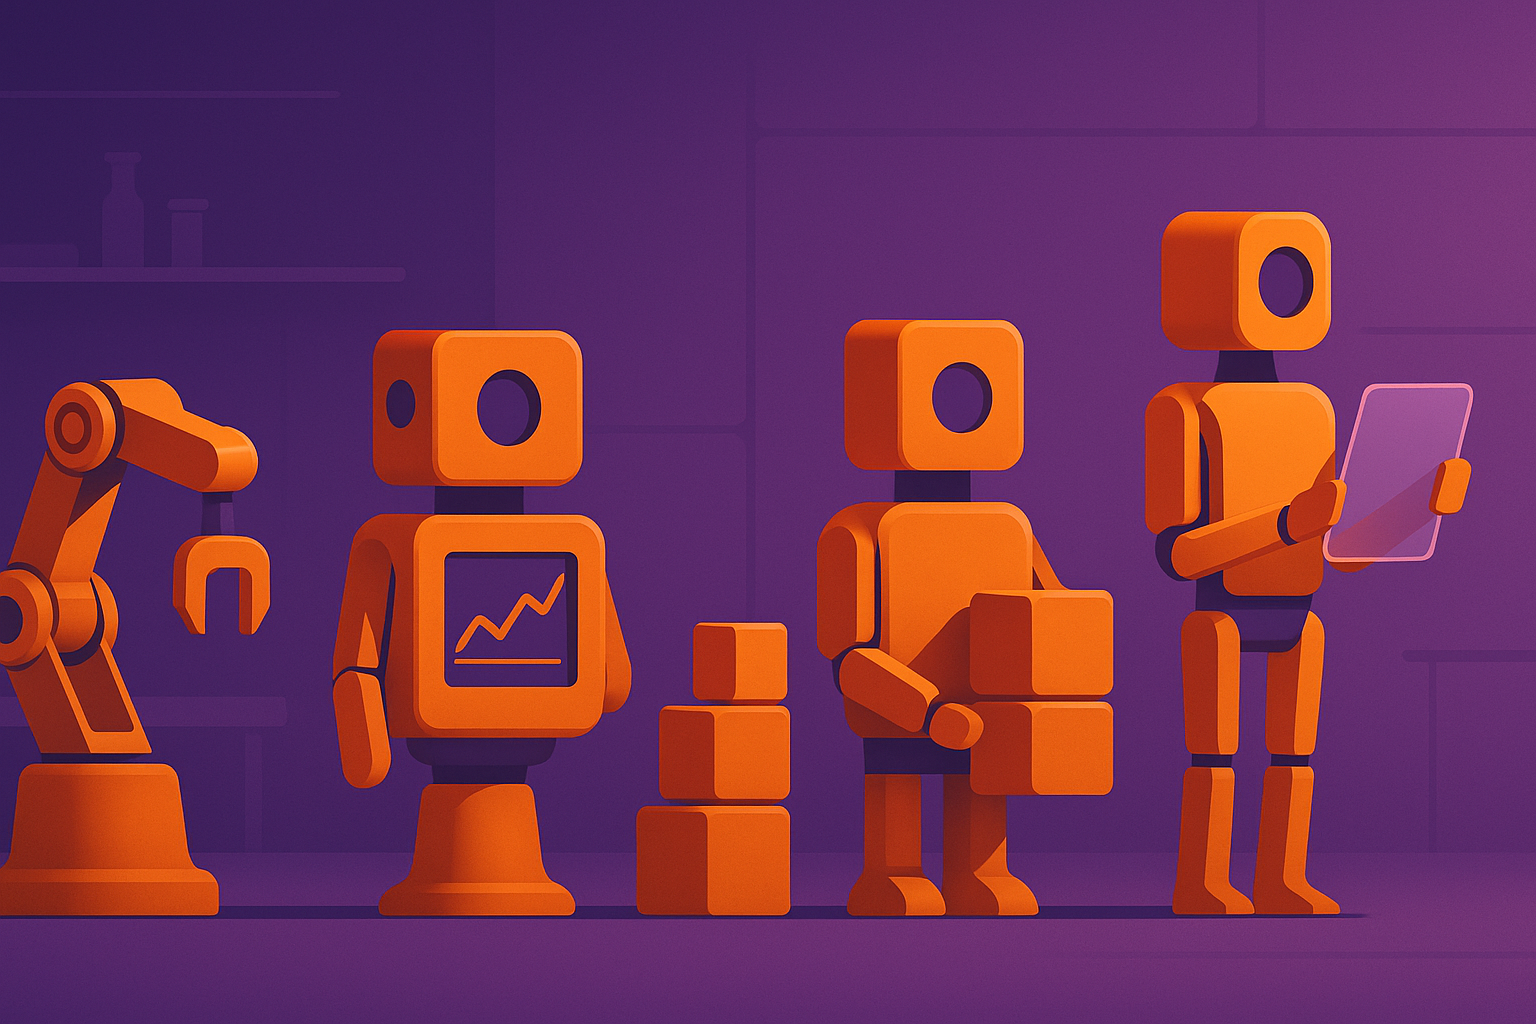
Real companies deal in tens of thousands of short, noisy time series, full of gaps, with horizons and sampling frequencies that keep changing. The hard part is not the model — it is everything around it: cleaning the data, validating it properly, building ensembles, producing reports that survive an audit. Narrow domain-specific solutions transfer badly between domains, and general-purpose ones tend to break on dirty data. The authors take a refreshing angle: instead of racing to build one more model, assemble an LLM-based multi-agent system that imitates a careful researcher and covers the whole pipeline, from input file to a report anyone can check.
Inside TSci
TSci is four agents working in concert, each with its own role and its own toolset.
- Curator: diagnoses the data, repairs gaps and outliers, builds visualizations and pulls out the structure of the series — trend, seasonality, stationarity.
- Planner: reads the diagnostics and the plots, picks model families from a library of 21 options ranging from ARIMA to gradient boosting and simple neural networks, tunes the hyperparameters, and writes a short justification for each choice.
- Forecaster: trains the top-k models and decides how to combine their forecasts — take the best one, average by quality, or apply robust aggregation.
- Reporter: assembles a transparent report with metrics, assumptions, confidence estimates and a complete log of the decisions made.

Looking at the plots, not just the numbers
TSci does not rely on textual context alone; it also extracts features from the charts. Simple visual descriptors — taken from the overview plot, the decomposition, the ACF/PACF — help Planner narrow the shortlist and help Curator make the right preprocessing calls. It is a practical compromise: lightweight visual analysis without heavy computer vision, but with a real payoff for model choice and settings.

From a forecast to a report you can audit
Reporter does not simply glue the pictures together. It records:
- the final ensemble forecast and its confidence intervals;
- metrics for every candidate model and for the ensemble;
- an explanation of why these models and these weights;
- assumptions and limitations;
- the full trace of tool-level decisions.
A report like that is easier to discuss with domain experts and easier to hand between teams.
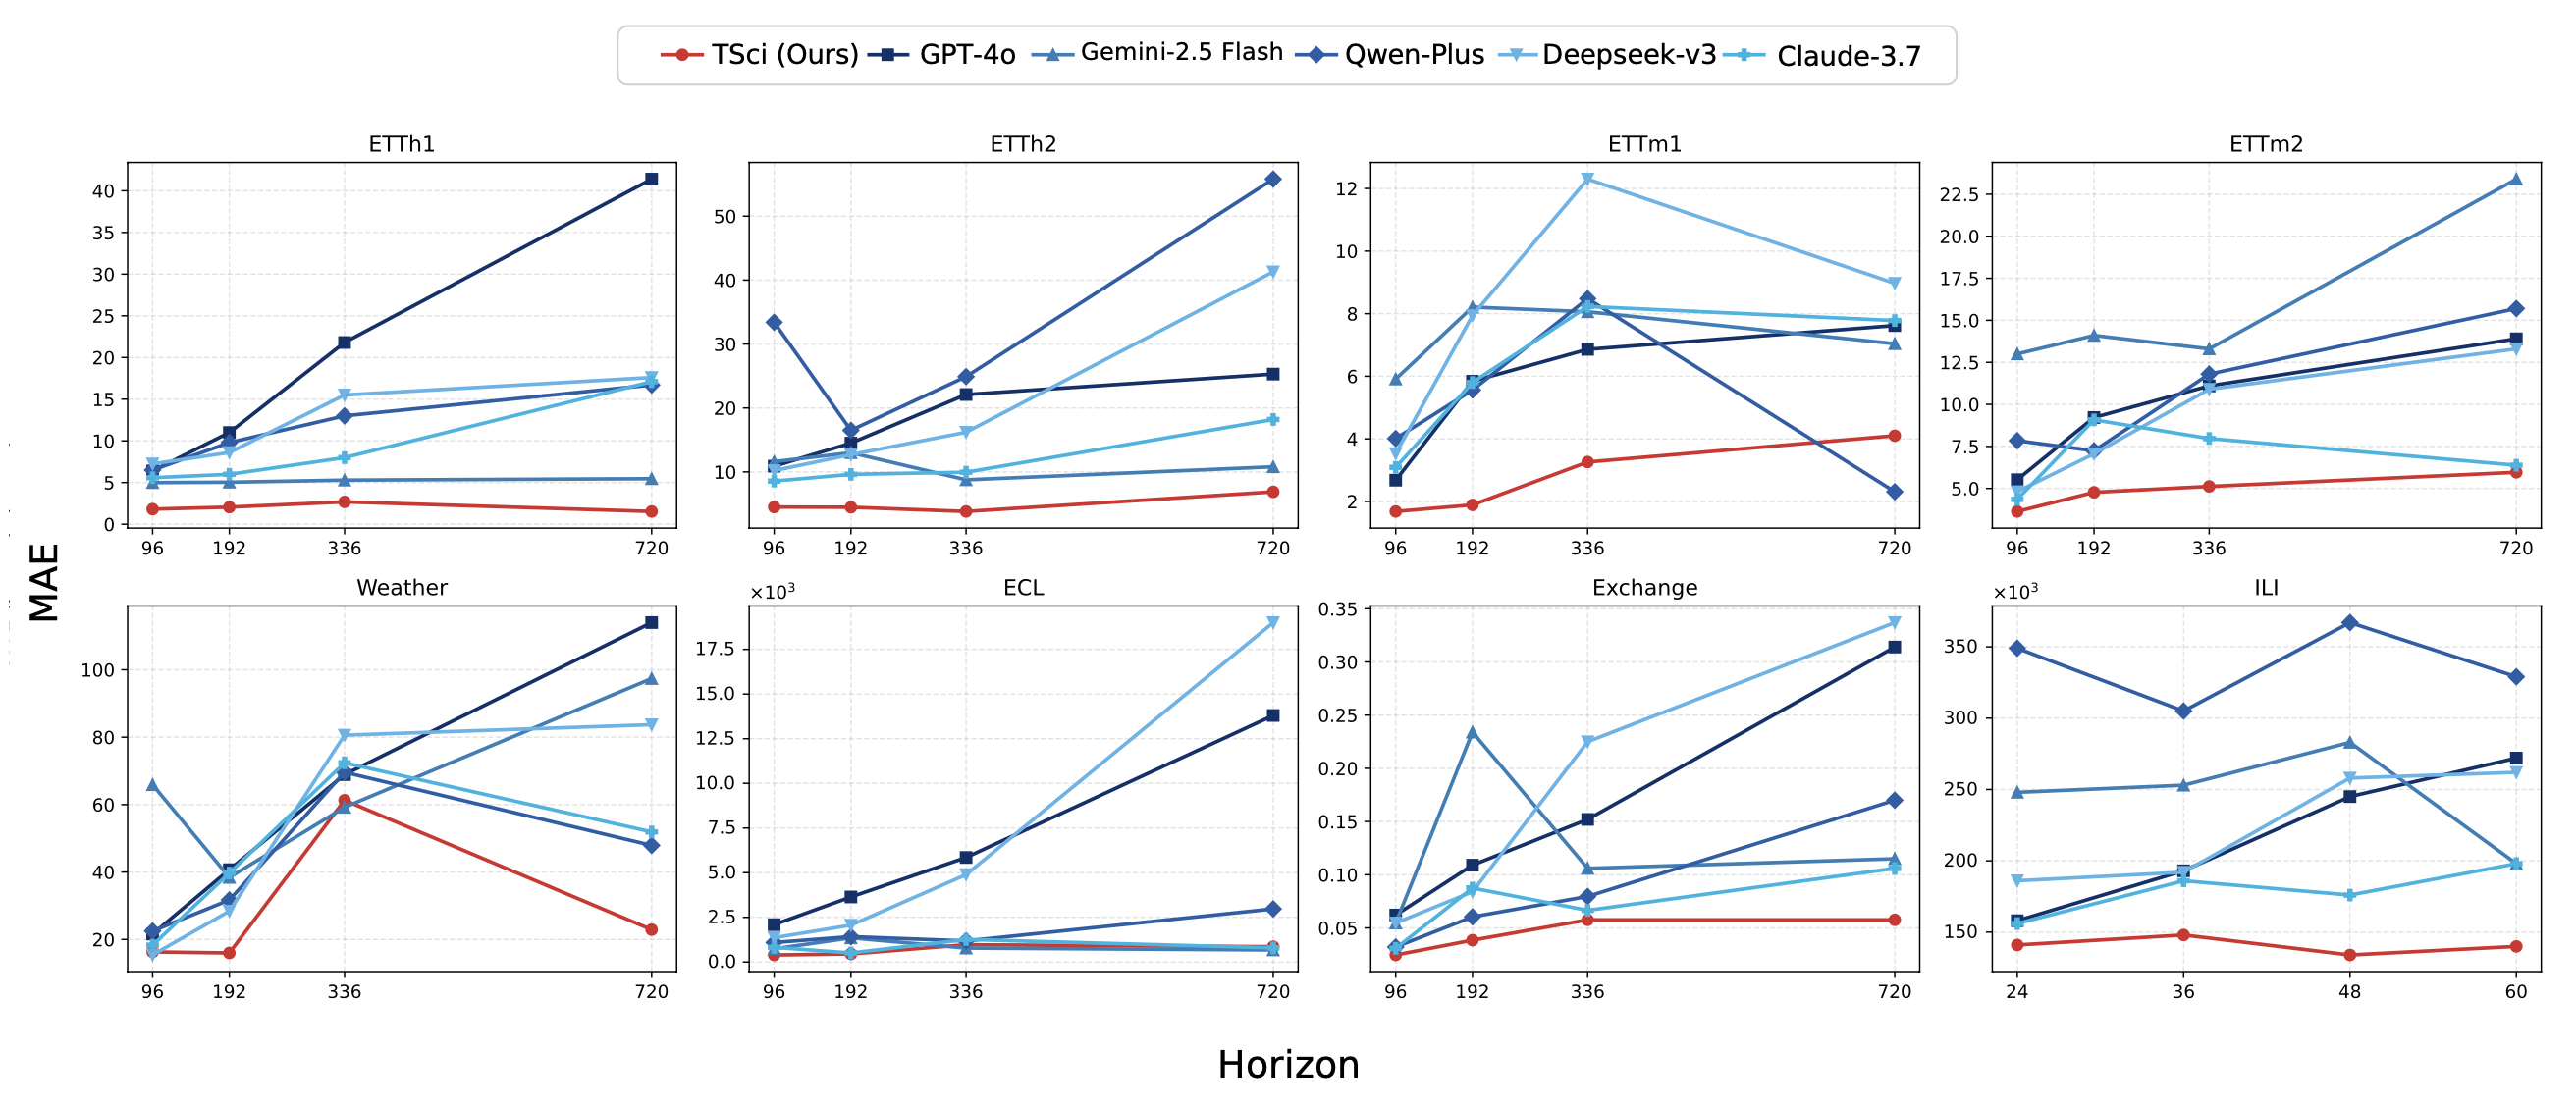
The authors tested TSci on eight benchmarks from five domains: energy, climate, finance, health. On average the system cuts error by 10.4% against statistical baselines and by 38.2–38.3% against LLM baselines. The gap is widest on hard datasets with long horizons and strong seasonality. On Weather, TSci's mean MAE is below every competitor; on ECL it comfortably beats both statistical and LLM approaches; on Exchange and ILI the advantage holds even with short histories.
Why it works
The ablations are honest about what each component contributes. Remove the preprocessing and MAE jumps by 41.8% on average. Strip out Curator's analysis stage and you add another 28.3%. Turn off hyperparameter tuning and the degradation is clear, especially at long horizons, where the cost of an error compounds. In other words, what wins is not one clever model but a well-designed process: diagnostics, a sensible shortlist, validation, and a robust ensemble.

In pairwise comparisons of reports against five LLM systems, TSci wins more often on every quality dimension — from the soundness of the analysis and the model selection to the structure and practicality of the recommendations. The margins are largest on rigorous argumentation and explanations.
Case study: electricity
The slice of ECL they picked shows pronounced cycles and non-stationarity. Planner favored ARIMA, Prophet and exponential smoothing; the ensemble raised the weights of the models that capture seasonality better. Over a long horizon the individual models accumulate error, while the ensemble stays stable and follows the cyclical pattern.


The takeaway
TSci shifts the focus away from the model and onto the process around the data. For teams that means less manual routine, fewer mistakes during preparation, more stability and better explanations. It also matters that the model library is broad and the decisions are auditable, which makes adoption easier in domain-agnostic settings. The authors see the next steps as support for multimodal setups, plugging in external knowledge, and improving efficiency at scale.
AI paper breakdowns
Every day we read the new AI papers and retell what matters in plain language — no hype, no filler. If you want to see where AI agents are heading before everyone else, subscribe.
New breakdowns every day.
On Telegram